In an age overwhelmed by information, the ability to digest and interpret data visually can empower students to excel in their academic pursuits. Infographics play a pivotal role in transforming complex information into engaging visuals, making learning more accessible and enjoyable for secondary education students.
Enhancing Comprehension and Engagement
Incorporating infographics into the secondary education curriculum can significantly enhance students’ comprehension and retention of material. Visual elements allow learners to connect ideas and concepts, transforming abstract concepts into tangible representations. By leveraging color, shapes, and informative layouts, educators can foster a more inviting learning atmosphere that encourages exploration and curiosity.
The Role of Visual Literacy
Understanding visual literacy is increasingly essential in today’s digital landscape. As students navigate a world filled with images and graphics, the ability to analyze and interpret visual information becomes critical. Infographics act as powerful tools that facilitate this skill by allowing learners to decipher data, identify trends, and synthesize information effectively—all of which promote critical thinking and analytical skills necessary for academic success.
Optimal Utilization in the Classroom
Employing infographics strategically throughout the academic year can elevate student learning experiences. For instance, during project-based learning or when introducing new topics, infographics can serve as visual guides that outline key concepts and data points. Additionally, utilizing infographics during assessments can help students illustrate their understanding creatively, providing a comprehensive approach to evaluation.
Transforming Learning Experiences
The integration of infographics into secondary education not only enriches the learning experience but also promotes student engagement across diverse subjects. By creating their own infographics, students can develop their creativity and design-thinking skills while also reinforcing their understanding of the material. This hands-on approach not only cultivates visual literacy but also encourages collaboration among peers, enhancing social skills and teamwork.
Frequently Asked Questions
What are infographics?
Infographics are visual representations of information, data, or knowledge designed to present information quickly and clearly. They often combine graphics, charts, and text to communicate complex ideas effectively.
How do infographics improve learning?
By simplifying large amounts of data into visually digestible formats, infographics enhance understanding and retention, making it easier for students to grasp complex subjects.
Can students create their own infographics?
Yes! Encouraging students to create their infographics fosters creativity, critical thinking, and a deeper understanding of the subject matter, making learning an interactive experience.
Are infographics effective in all subjects?
Absolutely! Infographics can be applied across various subjects, including science, history, and math, providing a versatile tool for visualizing relationships and concepts in any discipline.
Infographics for Supporting Visual Literacy in Secondary Education
The primary audience for infographics in secondary education includes students and educators eager to enhance teaching and learning experiences. My personal experience with infographics has been transformative. I vividly remember a project in my history class where we were tasked with creating an infographic on the Industrial Revolution. This assignment not only made the vast amounts of information manageable but also allowed my peers and me to visualize the cause-and-effect relationships of historical events. As we brainstormed design choices and debated what facts to include, I noticed that my classmates engaged in deeper discussions and developed a strong understanding of the complexities of that era. Resources like  and
and  can further enhance this experience by providing effective templates and examples for infographic design, demonstrating the power of visual literacy.
can further enhance this experience by providing effective templates and examples for infographic design, demonstrating the power of visual literacy.
Bringing It All Together
Incorporating infographics into secondary education can significantly uplift the learning environment, enriching comprehension, engagement, and visual literacy among students. As educators look for innovative tools to facilitate learning, infographics stand out as an impactful option that inspires creativity and collaboration in the classroom while equipping students with essential skills for the future.
If you are looking for Early Literacy – Parker Memorial Library you’ve came to the right place. We have 10 Images about Early Literacy – Parker Memorial Library like Early Literacy – Parker Memorial Library, Searching For Visual Literacy: Secondary School Students Are Creating and also Infographic On Reading. Here it is:
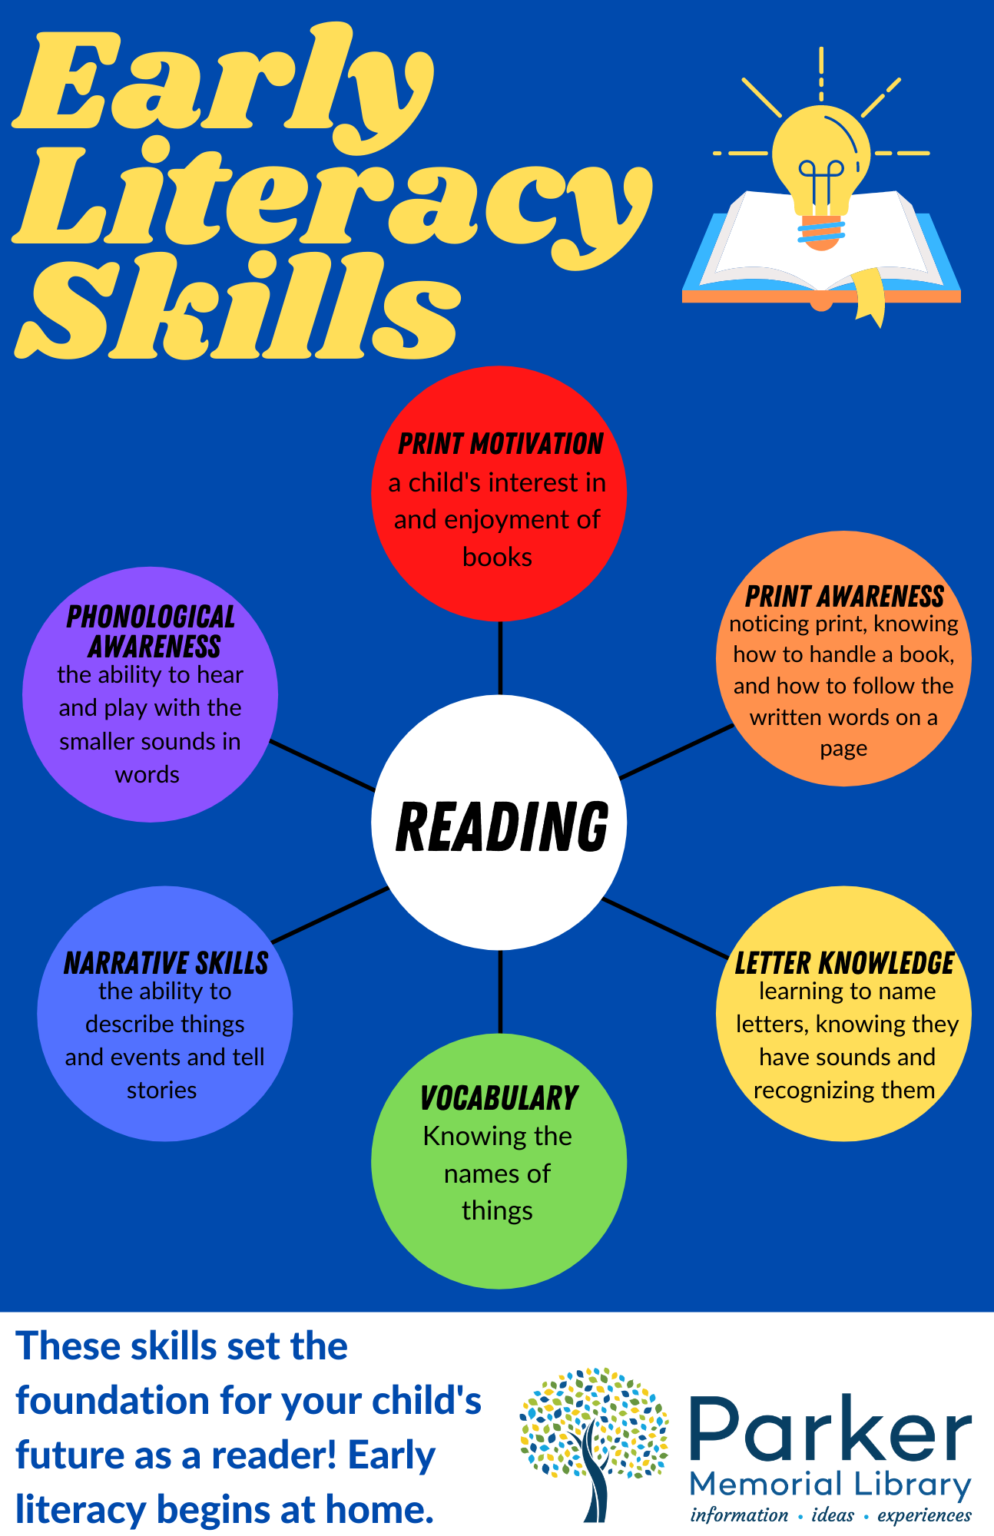
Early Literacy – Parker Memorial Library

www.dracutlibrary.org
infographic
Visual Literacy | Visual Literacy, Secondary English Classroom, Teaching

www.pinterest.com
Educational Infographic : Why Language Learning Is Important | Visual

infographicnow.com
educational infographic visual ly important language learning why infographicnow visualisation data
Infographics, Visual Literacy And PBL

www.slideshare.net
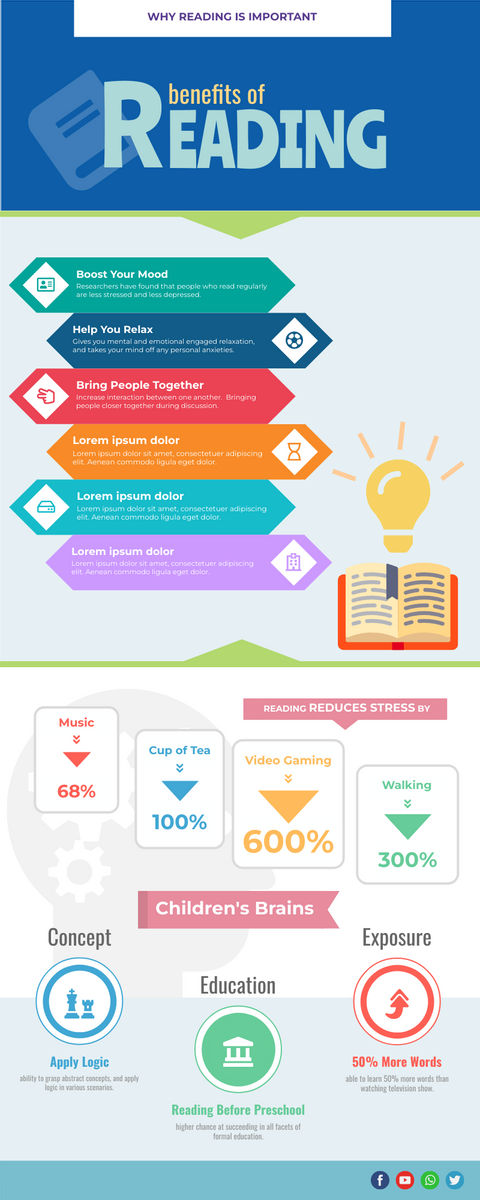
Infographic On Reading

www.animalia-life.club
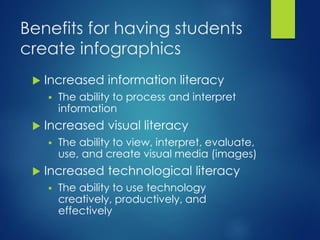
Infographics In The Classroom | PPT

www.slideshare.net
Visual Literacy: Part 2 | PPT

www.slideshare.net
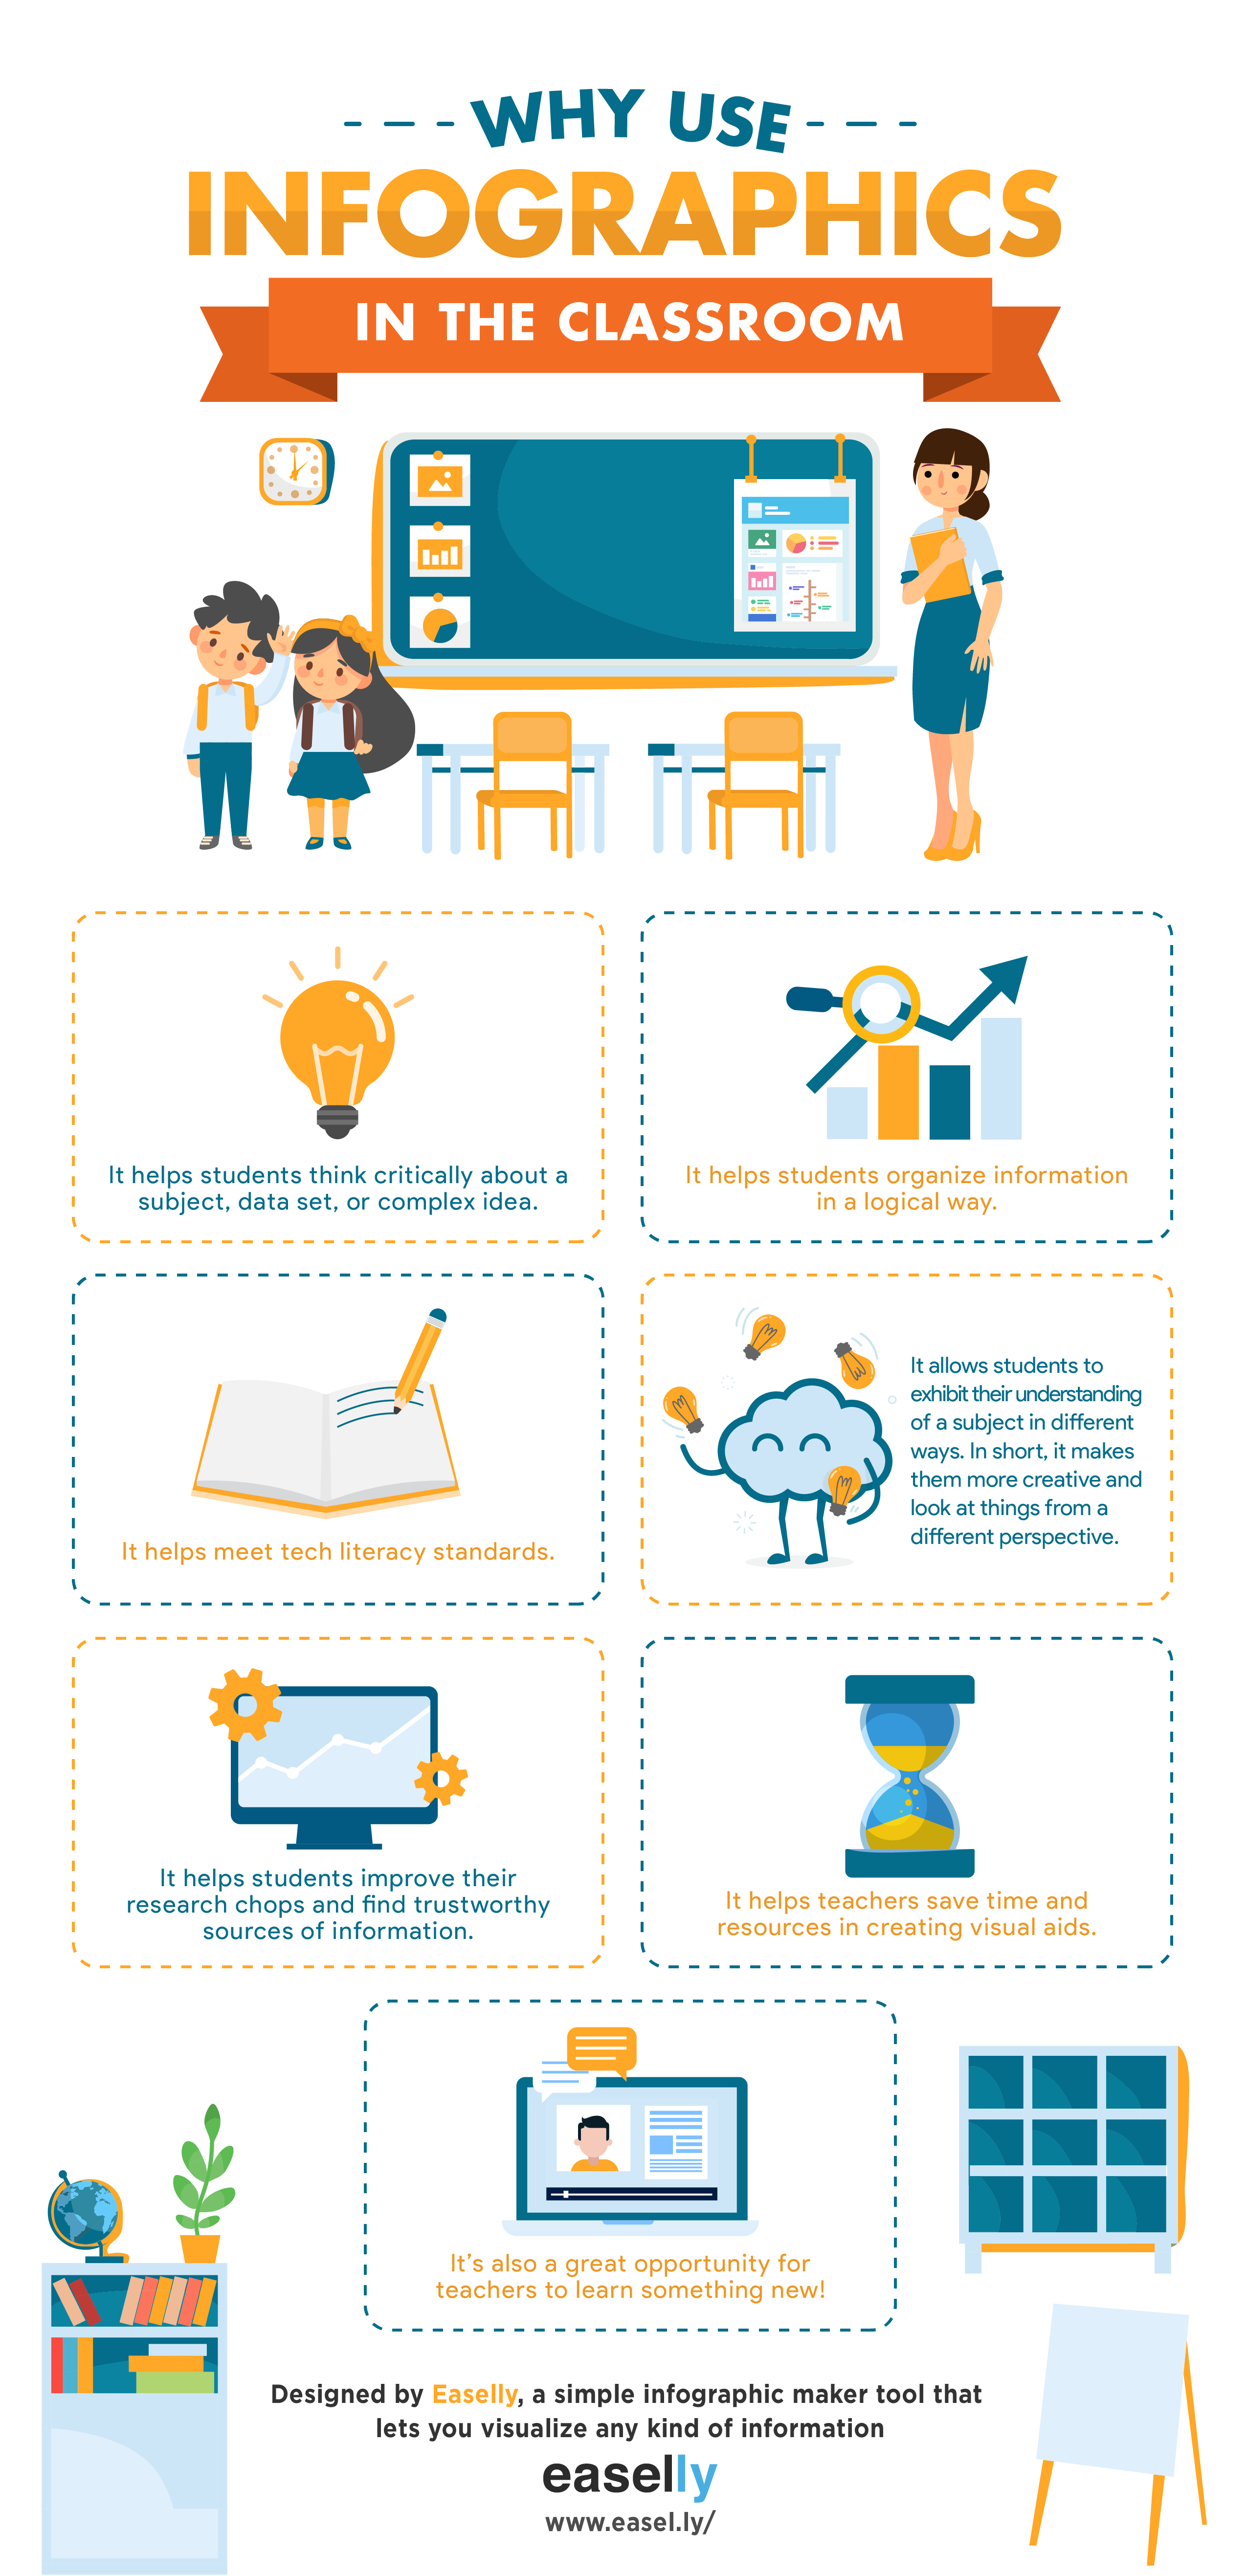
Nurture Deeper Learning In The Classroom Through Infographics And

blog.clever.com
infographics classroom benefits learning teaching students why visual use effective infographic through literacy simple deeper nurture clever create easelly education
Searching For Visual Literacy: Secondary School Students Are Creating
www.scribd.com
Teaching With Infographics | PPT

www.slideshare.net
Visual literacy: part 2. Nurture deeper learning in the classroom through infographics and. Infographic on reading


/71sJv2wLCfL._SL1500_-5804ea5d5f9b5805c2b24906.jpg)