In today’s fast-paced educational landscape, fostering effective learning strategies is more critical than ever, particularly in science education. Infographics have emerged as a powerful tool that not only simplifies complex information but also enhances engagement among students. Understanding how to leverage infographics can transform the way visual literacy is perceived in science classrooms.
The Case for Infographics in Science Education
Integrating infographics into science education addresses various challenges educators face. Students often struggle with dense texts and complex concepts; infographics break down these barriers by presenting information in visually appealing and easily digestible formats. This approach not only aids in comprehension but also cultivates a more interactive learning environment conducive to exploration and inquiry.
The Role of Infographics in Learning
Utilizing infographics fosters deeper understanding and retention of scientific principles. When students can visualize data and processes, they are more likely to grasp intricate concepts such as ecosystems, chemical reactions, and physical laws. This form of visual literacy teaches learners to interpret data effectively, laying a foundation for critical thinking that extends far beyond the classroom.
Optimal Timing for Infographic Use
Incorporating infographics at strategic points throughout the curriculum can significantly enhance learning. Ideal moments include introducing new topics or when summarizing key concepts. Also, using infographics during group projects encourages collaboration and discussion among students, reinforcing their understanding through peer interaction.
The Value Gained from Infographics
Using infographics in science education leads to improved engagement and motivation, essential for young learners. These visual tools not only captivate students’ attention but also stimulate curiosity, prompting them to delve deeper into scientific inquiries. Moreover, the integration of graphics with data not only promotes creativity but also helps students develop essential analytical skills.
Frequently Asked Questions
Q1: How can infographics help in science education?
Infographics aid comprehension by visually presenting complex scientific ideas, making them easier for students to digest and remember.
Q2: What tools are recommended for creating infographics?
Popular tools includes Canva, Piktochart, and Venngage, which provide templates tailored for educational content.
Q3: Can infographics cater to different learning styles?
Yes, infographics can be tailored to visual, auditory, and kinesthetic learners, accommodating diverse educational needs.
Q4: What age groups can benefit from infographics?
All age groups, from elementary to higher education, can benefit from infographics as they facilitate learning across various cognitive levels.
Infographics for Supporting Visual Literacy in Science Education
The primary audience for infographics in this context includes students, educators, and curriculum developers. During my first experience creating an infographic for a science project, I was amazed at how my understanding of the subject deepened. By transforming complex data about ecosystems into a visually engaging format, I was able to not only enhance my own learning but also facilitate discussions with classmates. This makes infographics a crucial tool for fostering visual literacy in science education.
Using visuals like this helped convey the interconnectedness of ecosystems, allowing for a more profound appreciation of biodiversity among my peers.
Insights into Infographics for Supporting Visual Literacy in Science Education
Reflecting on my journey, it’s evident that infographics are not merely tools but essential building blocks for promoting visual literacy in science education. They bridge gaps in understanding and foster collaboration among learners, ultimately enhancing their educational experience.
Conclusion of Infographics for Supporting Visual Literacy in Science Education
Embracing infographics provides a multifaceted approach to teaching science that resonates with today’s students. As the demand for visual literacy continues to grow, infographics stand out as an innovative solution that enhances comprehension, engagement, and retention of scientific knowledge. By effectively integrating these visual tools into education, we prepare students not only for academic success but for their future endeavors in an increasingly data-driven world.
If you are searching about Nurture Deeper Learning in the Classroom through Infographics and you’ve visit to the right page. We have 10 Pictures about Nurture Deeper Learning in the Classroom through Infographics and like Nurture Deeper Learning in the Classroom through Infographics and, Early Literacy – Parker Memorial Library and also Exploring Scientific Literacy – Science Education Research Group. Read more:
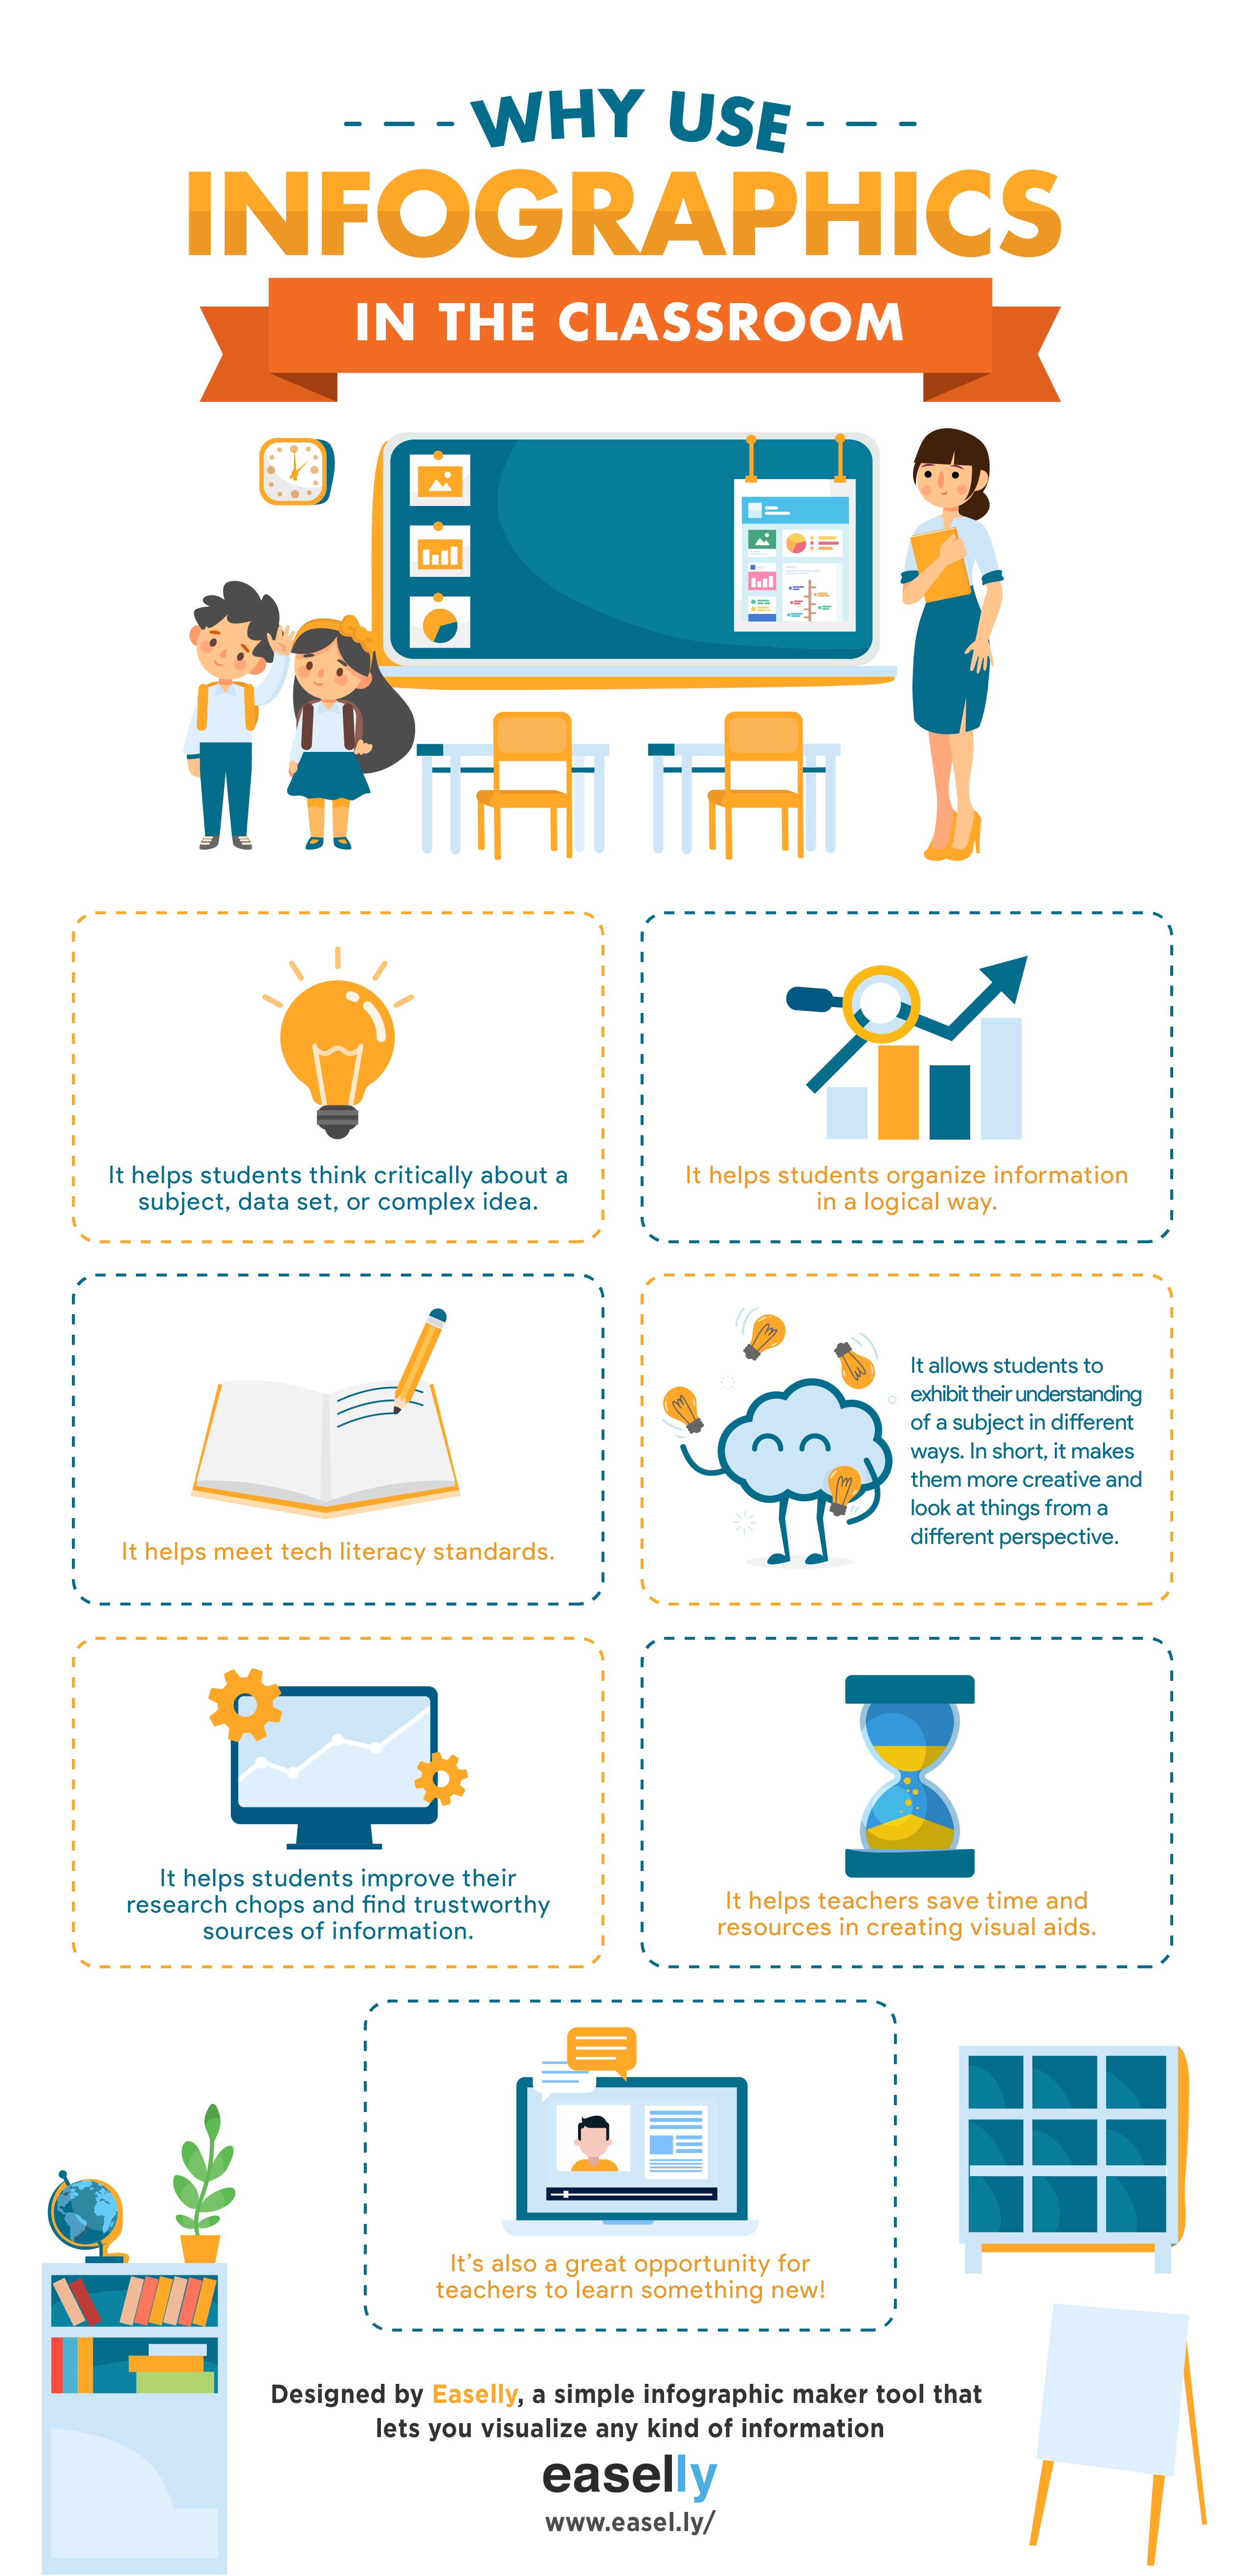
Nurture Deeper Learning In The Classroom Through Infographics And
blog.clever.com
infographics classroom benefits learning teaching students why visual use effective infographic through literacy simple deeper nurture clever create easelly education
5 Benefits Of Early Reading – Q-dees Blog
www.q-dees.com
benefits infographic dees
Visual Literacy With English Learners – Seidlitz Education
seidlitzblog.org
learners seidlitz gonzalez
Early Literacy – Parker Memorial Library
www.dracutlibrary.org
literacy skills
Infographics: Where Information Literacy And Visual Literacy Meet! #
www.pinterest.com
infographics program literacy information 21st march infographic visual where saved meet
Infographics + Infografías = Visual Literacy For All! – ICivics: Civics
icsl.icivics.org
Worldwide Literacy Infographic | Health Literacy, Literacy, Reading Facts
www.pinterest.com
literacy facts infographic statistics health reading stats world activities illiterate interesting info social women library did know rate people public
Exploring Scientific Literacy – Science Education Research Group
www.monash.edu
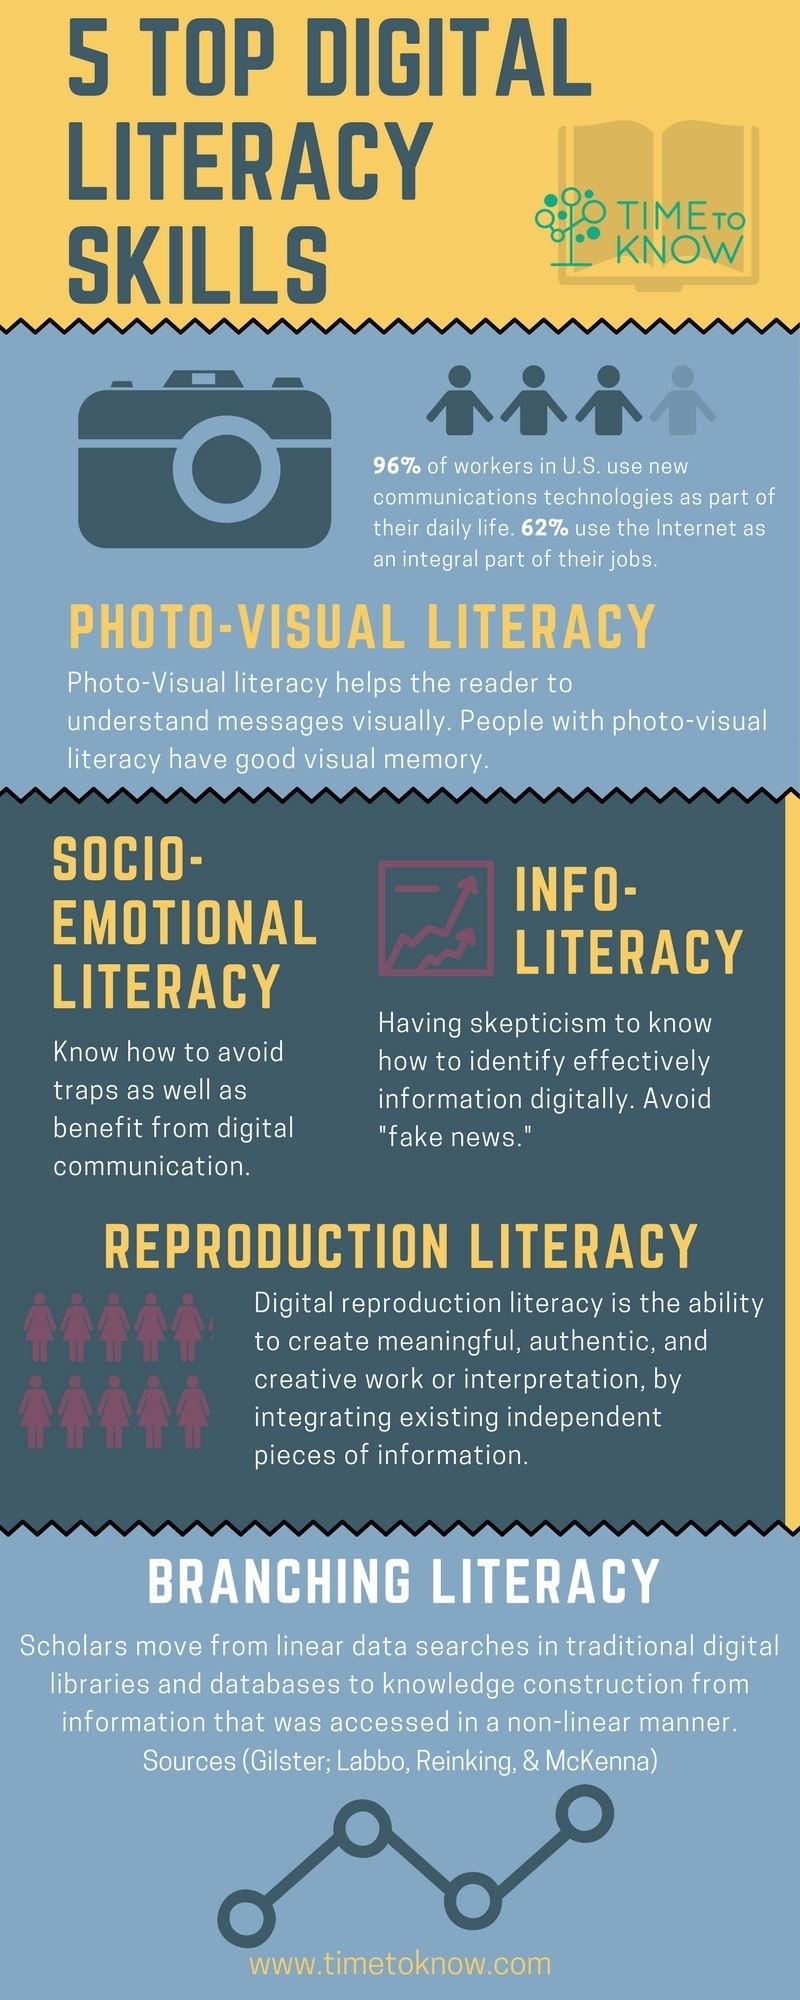
Habilidades Esenciales De Alfabetización Digital Para El Trabajador Del
universoabierto.org
Recognizing Dyslexia And Its Implications, Part 1 – SoundEnglish
soundenglish.org
ladder literacy dyslexia explicit phonics infographics evidence learners awareness phonemic systematic structured recognizing implications words heggerty realizing embracing debate dyslexiaida
Learners seidlitz gonzalez. Infographics classroom benefits learning teaching students why visual use effective infographic through literacy simple deeper nurture clever create easelly education. Infographics program literacy information 21st march infographic visual where saved meet