In a world increasingly governed by visual communication, infographics have emerged as a powerful tool for conveying complex information succinctly and effectively. For educators looking to raise awareness about significant environmental issues, understanding how to design infographics can transform traditional teaching methods and engage learners in meaningful ways.
Creating Effective Infographics for Environmental Education
Utilizing infographics enables educators to distill vital information into digestible visuals that can enhance understanding and retention. By attracting attention through vibrant graphics and succinct data representation, these visual aids can significantly improve student engagement and knowledge on pressing environmental topics.
Significance of Infographics in Environmental Awareness
Infographics serve as a bridge between intricate environmental concepts and the audience’s comprehension level. They break down data into visual formats, making complex information more accessible. Furthermore, infographics encourage critical thinking by prompting viewers to assess the implications of the visual data presented.
Optimal Timing and Context for Infographics in Teaching
These powerful visual tools can be most effective during specific learning phases or topics within an environmental curriculum. Whether integrated into lesson plans on climate change, biodiversity loss, or ecological problems, the timing of their use can enhance lesson relevance and make the subject matter come alive for students.
Advantages of Using Infographics in Environmental Education
Employing infographics fosters a dynamic learning environment that supports diverse learning styles. Visual learners, in particular, benefit from graphic representations of data that complement spoken or written information. This approach can lead to improved retention, as students are more likely to remember visual cues paired with factual content.
Frequently Asked Questions
1. What software can I use to create infographics?
There are various tools available such as Canva, Venngage, and Piktochart that simplify the design process for educators.
2. How can I effectively present infographics in class?
Consider incorporating interactive elements, such as group discussions or quizzes based on the infographics, to engage your students further.
3. Are there any recommended guidelines for designing infographics?
Maintain clarity by using simple language, clear visuals, and a logical layout to ensure your infographic effectively communicates its message.
4. Can infographics be used for all age groups?
Yes, infographics can be tailored to suit different age groups by adjusting complexity, color schemes, and themes.
How to Design Infographics for Teaching About Significant Environmental Issues
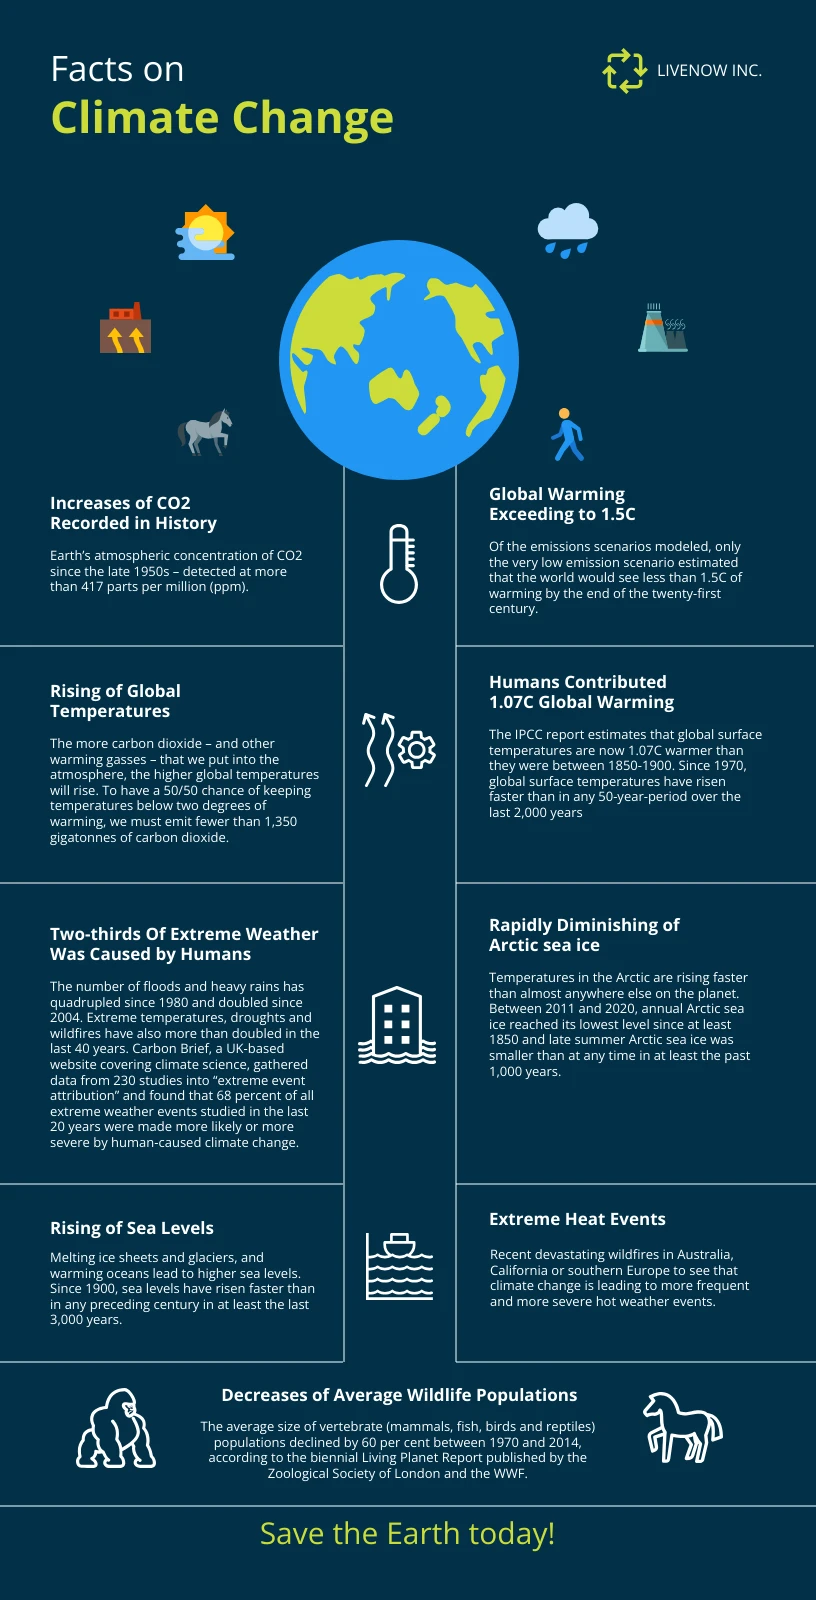
The target audience for infographics in environmental education primarily includes students ranging from elementary to high school levels. Reflecting on my experience with this, I recall a specific project where I created an infographic about climate change effects. Using a mix of icons, data points, and straightforward language allowed my peers to grasp critical concepts quickly.

Through this process, I realized how impactful visuals could be in sparking discussions and promoting environmental awareness. By presenting information such as the carbon cycle visually, we could enhance understanding and concern for climate issues, demonstrating the effectiveness of infographics as teaching aids.
Wrap-Up on Designing Infographics for Environmental Education
As you explore ways to incorporate infographics into your curriculum, remember that creativity and clarity are paramount. The journey of improving how we educate about significant environmental issues through visual storytelling opens up pathways for deeper understanding and activism among eager learners.
If you are searching about 5 Things You Can Do Around the Home to Help the Environment [Infographic] you’ve visit to the right web. We have 10 Images about 5 Things You Can Do Around the Home to Help the Environment [Infographic] like 5 Things You Can Do Around the Home to Help the Environment [Infographic], Free Infographic Templates, Designs & More | Easelly and also Free Infographic Templates, Designs & More | Easelly. Read more:
5 Things You Can Do Around The Home To Help The Environment [Infographic]
infographicjournal.com
infographic infographics infographicsarchive pollution visualistan
Infográfico Sobre O Meio Ambiente – Venngage
pt.venngage.com
Infographics In Education: Easelly As An NYC Schools Tech Partner
www.easel.ly
effective easelly learners easel educators batch asked
Page 2 | Pollution Globe Images – Free Download On Freepik
www.freepik.com
Ecological Problems Flat Infographics Royalty Free Vector
www.vectorstock.com
ecological infographics
Free Infographic Templates, Designs & More | Easelly
www.easel.ly
Free Infographic Templates, Designs & More | Easelly
www.easel.ly
Climate Change Infographic – Zilladop
zilladop.weebly.com
How Video Marketing Can Increase Your Site Traffic | Video Marketing
www.pinterest.com
Loss Of Biodiversity Infographic :: Behance
www.behance.net
environmental biodiversity loss conservation deforestation biology slogans degradation invernadero efecto extinction protect 출처 designlisticle
Free infographic templates, designs & more. Ecological problems flat infographics royalty free vector. Infographic infographics infographicsarchive pollution visualistan


