Infographics have emerged as a powerful tool in the educational landscape, enabling educators to present complex scientific theories in an engaging and comprehensible manner. When designed effectively, these visual aids can capture the attention of learners and facilitate deeper understanding. Embracing the art of creating infographics for teaching major scientific theories not only enhances the learning experience but also fosters critical thinking skills among students.
Creating Infographics for Scientific Theories
Crafting infographics tailored for teaching major scientific theories opens up unique opportunities to present information visually. By combining text, images, and data, educators can distill intricate theories into bite-sized pieces that are easy for students to digest. This approach supports diverse learning styles and helps reinforce core concepts in an informative yet stimulating way.
Understanding the Role of Infographics
Integrating infographics into educational practices is essential for enhancing student engagement and comprehension. They bridge the gap between complex data and student understanding, making it easier for learners to grasp substantial scientific concepts. Employing visual elements can also aid in retention, as the brain processes images far quicker than text, allowing students to recall information more effectively during assessments.
Optimal Timing for Infographic Design
Choosing the right moments to introduce infographics in teaching major scientific theories can significantly influence their effectiveness. Infographics are particularly beneficial during the initial stages of instruction, where clarity is vital, or when revisiting previously covered material for the purpose of reinforcement. Implementing them during group discussions or interactive sessions can also promote collaborative learning, making challenging theories more approachable.
Utilizing Infographics for Enhanced Learning
The use of infographics in teaching major scientific theories not only illustrates the content but also encourages active learning among students. By requiring learners to engage with visual materials, they cultivate investigative skills, prompting them to ask questions and seek further understanding beyond the classroom context. This interactive process is crucial for fostering a lifelong love of science and critical inquiry.
Frequently Asked Questions
- What tools can I use to create infographics for teaching?
There are several user-friendly tools such as Canva, Piktochart, and Visme that allow educators to design visually appealing infographics with ease. - How do I ensure my infographic is effective?
Focus on clarity, balance between text and visuals, and ensure that you are addressing the specific concepts necessary for understanding the scientific theory. - Can infographics be used across different age groups?
Absolutely! Infographics can be tailored to suit various age groups and learning levels, making them versatile tools for a broad range of educational settings. - How can I assess the impact of infographics on student learning?
Collect feedback through surveys or class discussions and compare students’ performance before and after using infographics to evaluate their understanding.
How to design infographics for teaching about major scientific theories
The aim of crafting infographics is to simplify complex theories, making them accessible and engaging. My experience in designing infographics to teach scientific principles has demonstrated their immense value. For instance, while preparing an infographic on the Scientific Method, I used a combination of visuals and concise explanations that helped students grasp the steps involved. I incorporated images like this one:
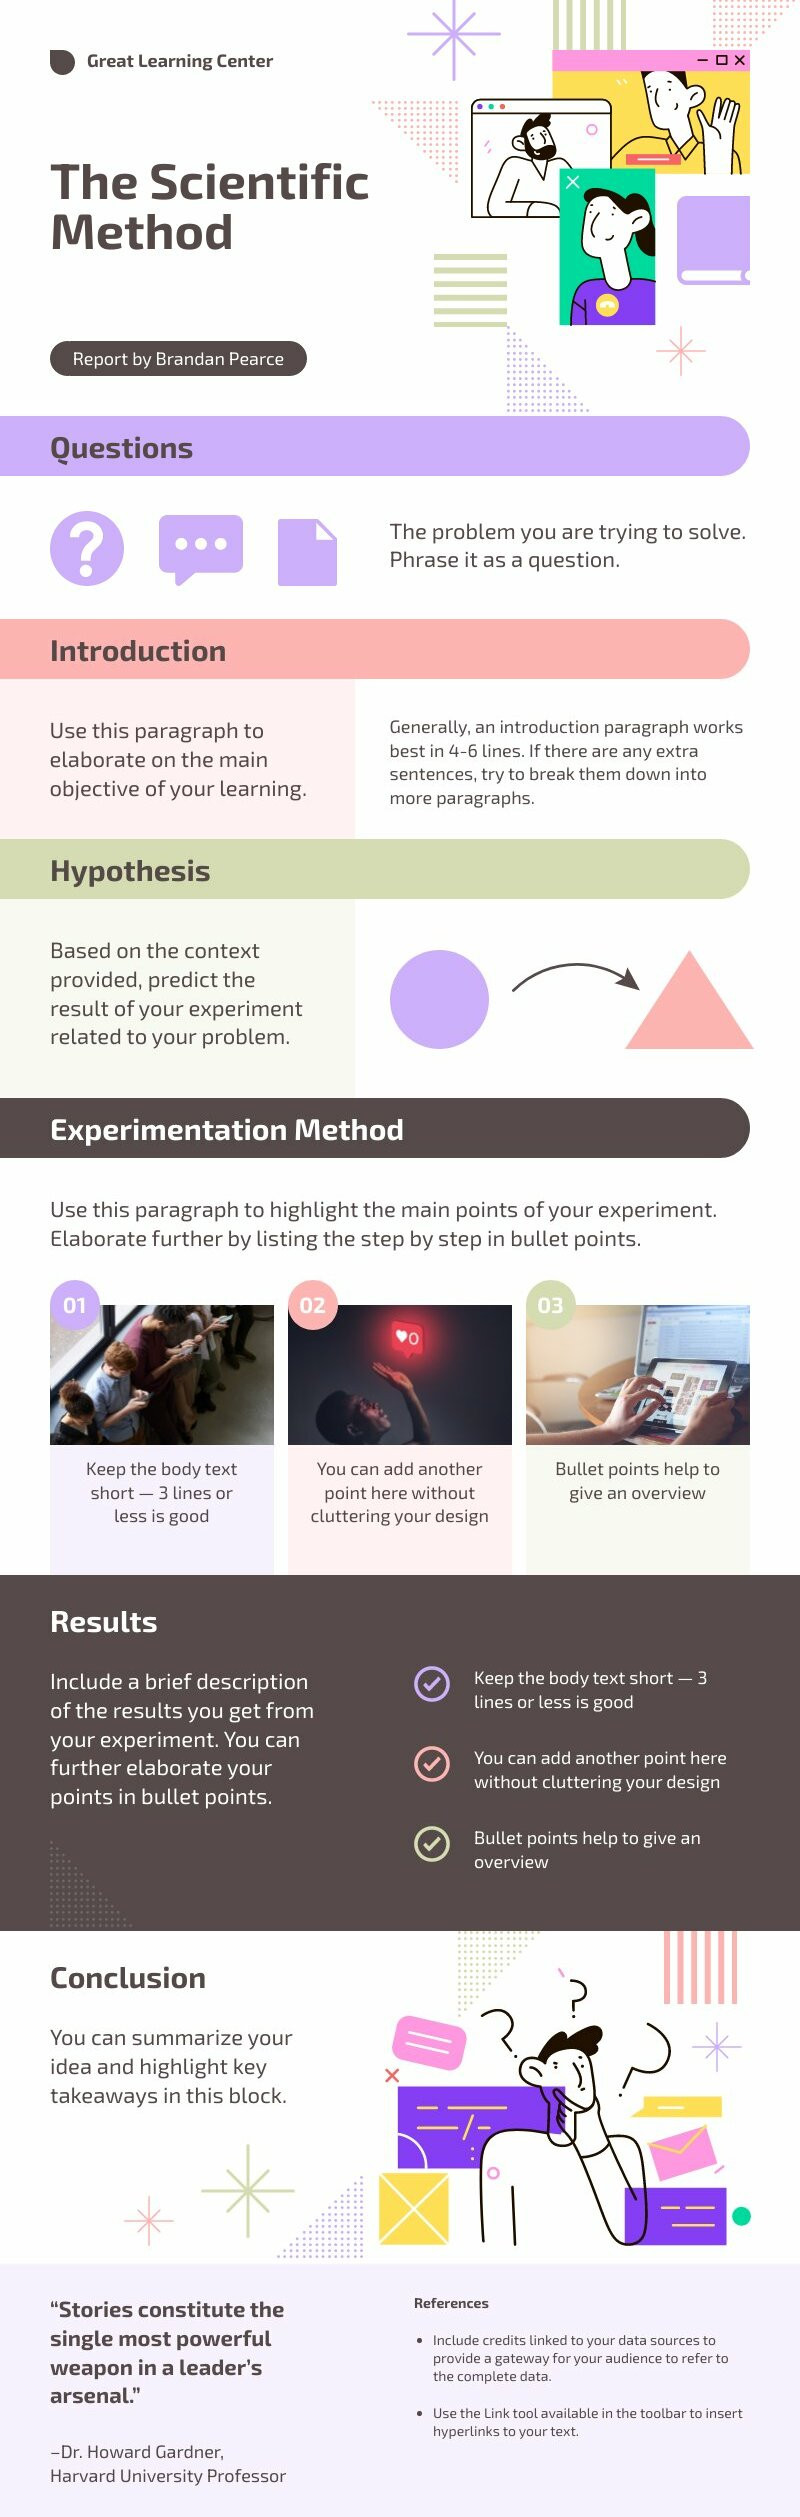
This visual representation, showcasing each step clearly, prompted discussions in my classroom, leading to a deeper understanding among students. The ability to break down major theories through visuals not only aids in comprehension but also sparks curiosity and engagement.
Final Thoughts on How to design infographics for teaching about major scientific theories
Exploring ways to design infographics for teaching major scientific theories opens new avenues for educational enhancement. By employing thoughtful designs and adequate visuals, educators can transform the learning environment. Engaging students through infographics not only demystifies challenging concepts but also creates an atmosphere conducive to active learning and inquiry. Ultimately, as we continue to integrate creative methods like infographics into educational paradigms, we set the foundation for a brighter, more informed future in science education.
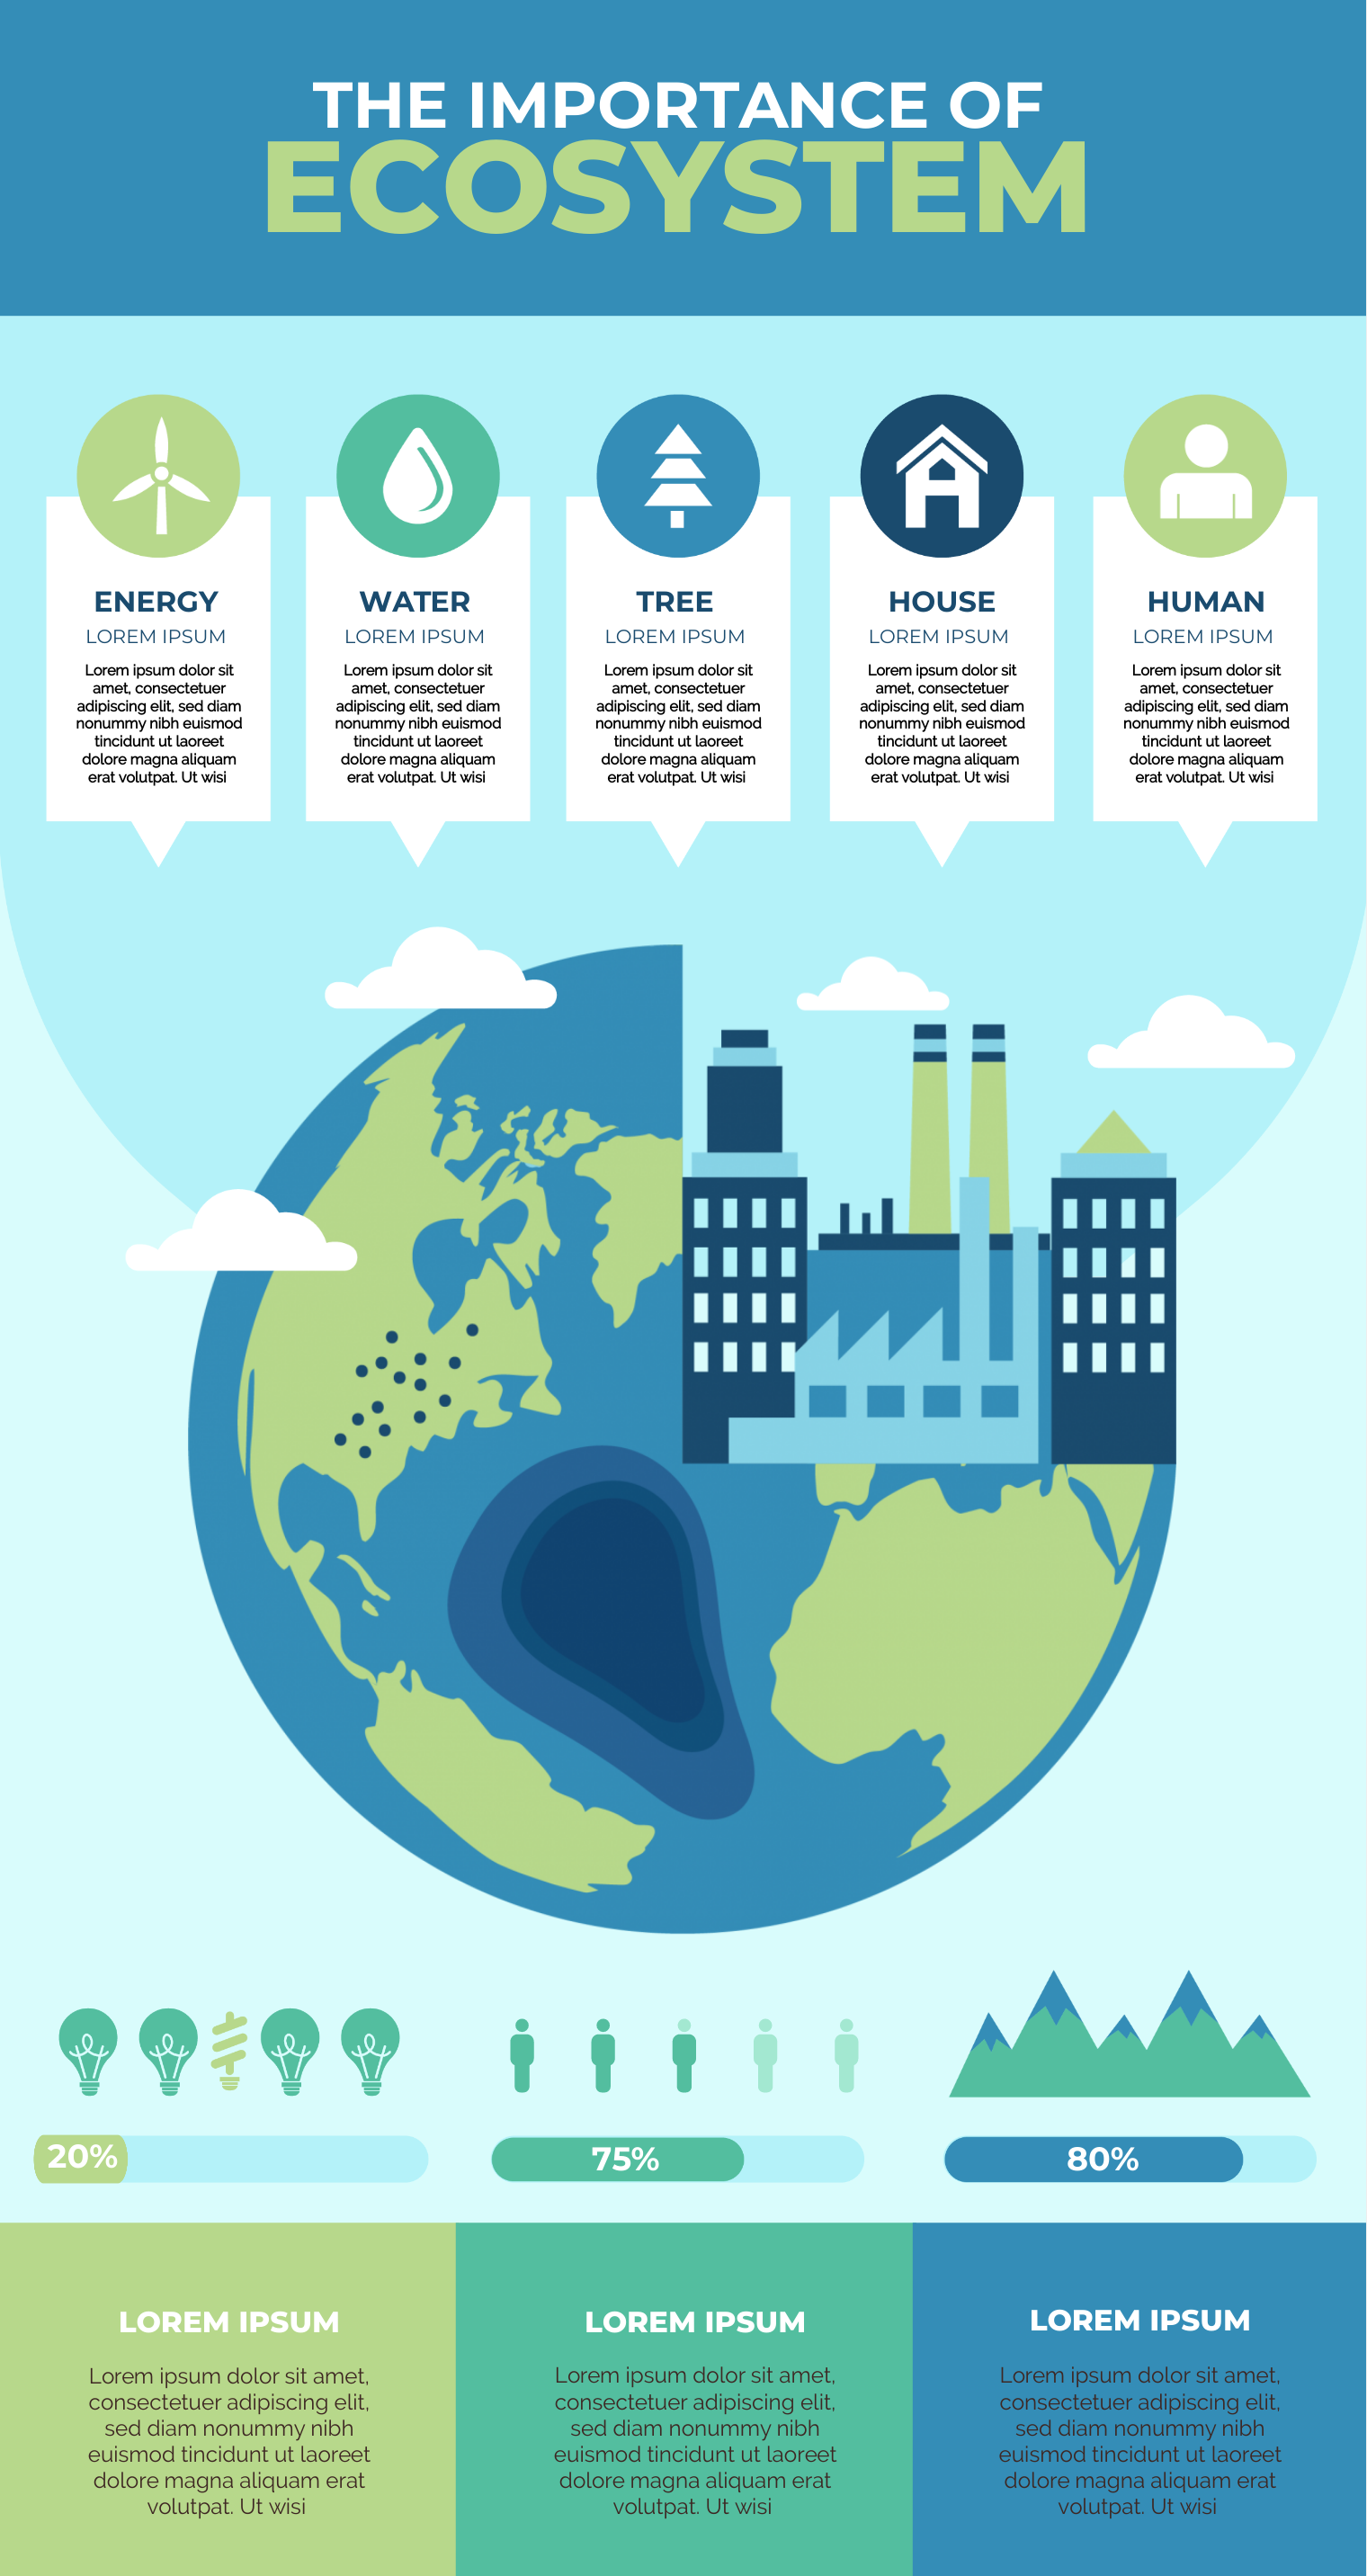
If you are looking for the science presentation is shown with icons and text you’ve visit to the right page. We have 10 Images about the science presentation is shown with icons and text like benefits of infographics for teaching and learning – Simple Infographic, Die wissenschaftliche Methode: Schritte und Prinzipien – Venngage and also Comparison of Learning Theories Infographic – e-Learning Infographics. Here you go:
The Science Presentation Is Shown With Icons And Text
www.pinterest.com
Die Wissenschaftliche Methode: Schritte Und Prinzipien – Venngage
de.venngage.com
3 Learning Theories Of Instructional Design Infographic – E-Learning
elearninginfographics.com
learning theories instructional elearninginfographics infographics shiftelearning management ubd blended andragogy nonsense quick graphic piaget comparing teachers learndash librarian individual
Famous Atomic Models And Their Associated Scientists | Teaching
mx.pinterest.com
Comparison Of Learning Theories Infographic – E-Learning Infographics
www.pinterest.com
learning theories theory comparison infographic educational adult infographics education behaviorism constructivism teaching technology mobile techniques cognitivism instructional elearninginfographics three psychology
Reality Therapy Infographics | Choice Theory, Reality, Therapy
www.pinterest.ph
The Scientific Method | Free Infographic Template – Piktochart
piktochart.com
Learning Theories Infographic Example | EdrawMax Templates
www.edrawmax.com
Infographic: Learning Theories | Learning Theory, Social Learning
www.pinterest.co.uk
theories learning theory education educational infographic definition teaching psychology social types early article childhood should development related influence saved characteristics
Benefits Of Infographics For Teaching And Learning – Simple Infographic
www.easel.ly
infographics classroom benefits learning teaching students use why visual effective infographic simple deeper education create nurture through make easelly learn
The scientific method. 3 learning theories of instructional design infographic. The science presentation is shown with icons and text