Infographics have revolutionized the way teachers present complex social studies concepts, transforming dryness into dynamic visual storytelling. If you’ve ever found yourself sifting through endless text while trying to grasp intricate topics like civil rights movements or global economics, you’ll appreciate the power of infographics in education. By unraveling complex information into easily digestible visuals, educators can engage students in ways traditional methods often fail to achieve.
The Need for Infographics in Education
Creating visual representations of complex social studies topics can enhance understanding and retention in students. Infographics simplify multifaceted information, helping students not only to grasp key concepts but also to see connections between related topics. For instance, when discussing the causes of historical events, a well-crafted infographic can illustrate timelines, impact, and outcomes more effectively than a lecture could ever do alone.
The Role of Visuals in Learning
Utilizing infographics enriches the learning experience and promotes critical thinking. By translating data and narratives into visual formats, educators empower students to analyze information actively and draw their conclusions. This process not only cultivates a deeper understanding of social studies concepts but also fosters essential skills such as interpreting information and expressing ideas clearly.
Timing and Setting for Infographic Use
Infographics can be introduced at various points in the curriculum. For example, teachers might deploy them as introductory materials to set the stage for deeper exploration of a topic or as review tools before assessments. Moreover, incorporating infographics into group projects allows peers to collaboratively engage with the material, encouraging discussion and diverse perspectives in social studies learning.
Advantages of Visual Learning Tools
Students benefit significantly from the incorporation of infographics into their learning toolkit. Notably, visuals cater to diverse learning styles, allowing visual learners to thrive while also supplementing auditory and kinesthetic learning. Infographics can spark interest, stimulate curiosity, and motivate students to delve deeper into complex topics, fostering a lifelong appreciation for social studies.
Frequently Asked Questions
1. What types of software can I use to create infographics?
Various tools are available such as Canva, Piktochart, and Visme, which cater to users with different design skills, making the infographic creation process accessible to everyone.
2. How can I assess students’ understanding of infographics?
You can evaluate their ability to interpret and analyze infographics in discussions or assign projects where they create their own visuals based on a social studies topic.
3. Are there any specific guidelines for designing effective infographics?
Yes, key guidelines include using clear visuals, a logical flow of information, and minimal text to enhance clarity and engagement.
4. Can infographics be used in remote teaching?
Absolutely! Infographics can be shared electronically and serve as effective teaching tools for remote learning, allowing students to engage with content asynchronously.
How to design infographics for teaching about complex social studies concepts
The target audience for creating infographics in social studies includes both teachers and students. During my own teaching experience, I stumbled upon the idea of incorporating infographics while working on a unit about the United Nations. I designed a comprehensive infographic illustrating the UN’s structure, functions, and significant contributions to global peacekeeping efforts. The visual appeal of the infographic not only captivated my students’ attention but also enabled them to grasp complex structures and roles more easily. They engaged in discussions, enhancing their understanding and sparking their curiosity about global affairs.

Through my experience, I realized that infographics facilitate not just retention but also inspire more profound discussions around complex subjects, bridging the gap between curriculum requirements and student engagement.
An Overview of How to design infographics for teaching about complex social studies concepts
In employing infographics, educators are not only enriching their instructional methods but also creating a vibrant learning environment that celebrates inquiry, creativity, and understanding.
If you are looking for Create infographics in Designs Cool by YO&O, Design Sydney. you’ve visit to the right web. We have 10 Pictures about Create infographics in Designs Cool by YO&O, Design Sydney. like Design Thinking Your Teaching Infographic – e-Learning Infographics, Infographic Explaining Infographics and also Design Thinking Your Teaching Infographic – e-Learning Infographics. Read more:
Create Infographics In Designs Cool By YO&O, Design Sydney.

youroneandonly.com.au
Classroom Design Infographic

mavink.com
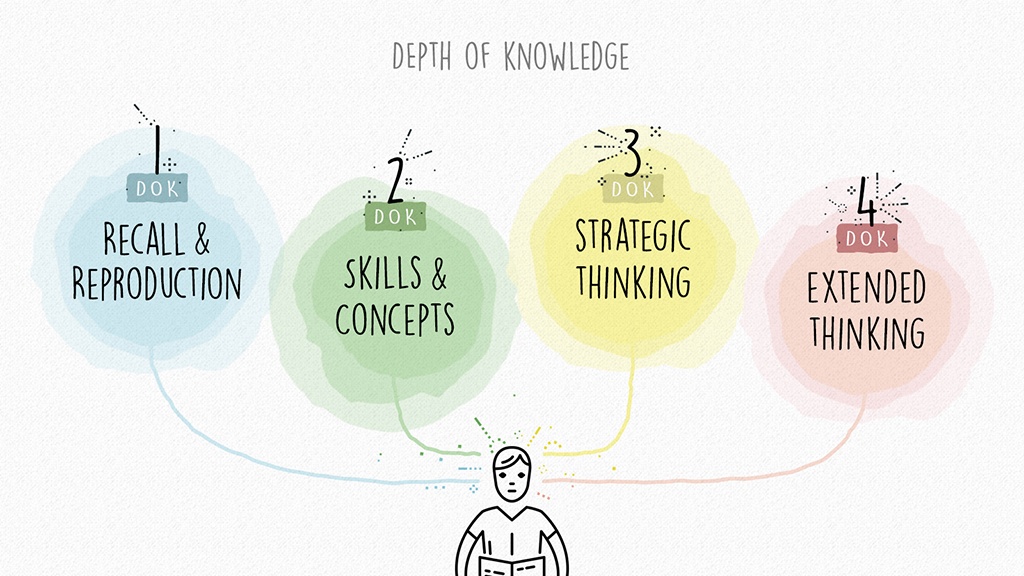
Teaching For Complex Thinking: Depth Of Knowledge – Social Studies

www.socialstudies.com
Information, Illustration & Design Infographic Classroom Projects, A

www.pinterest.cl
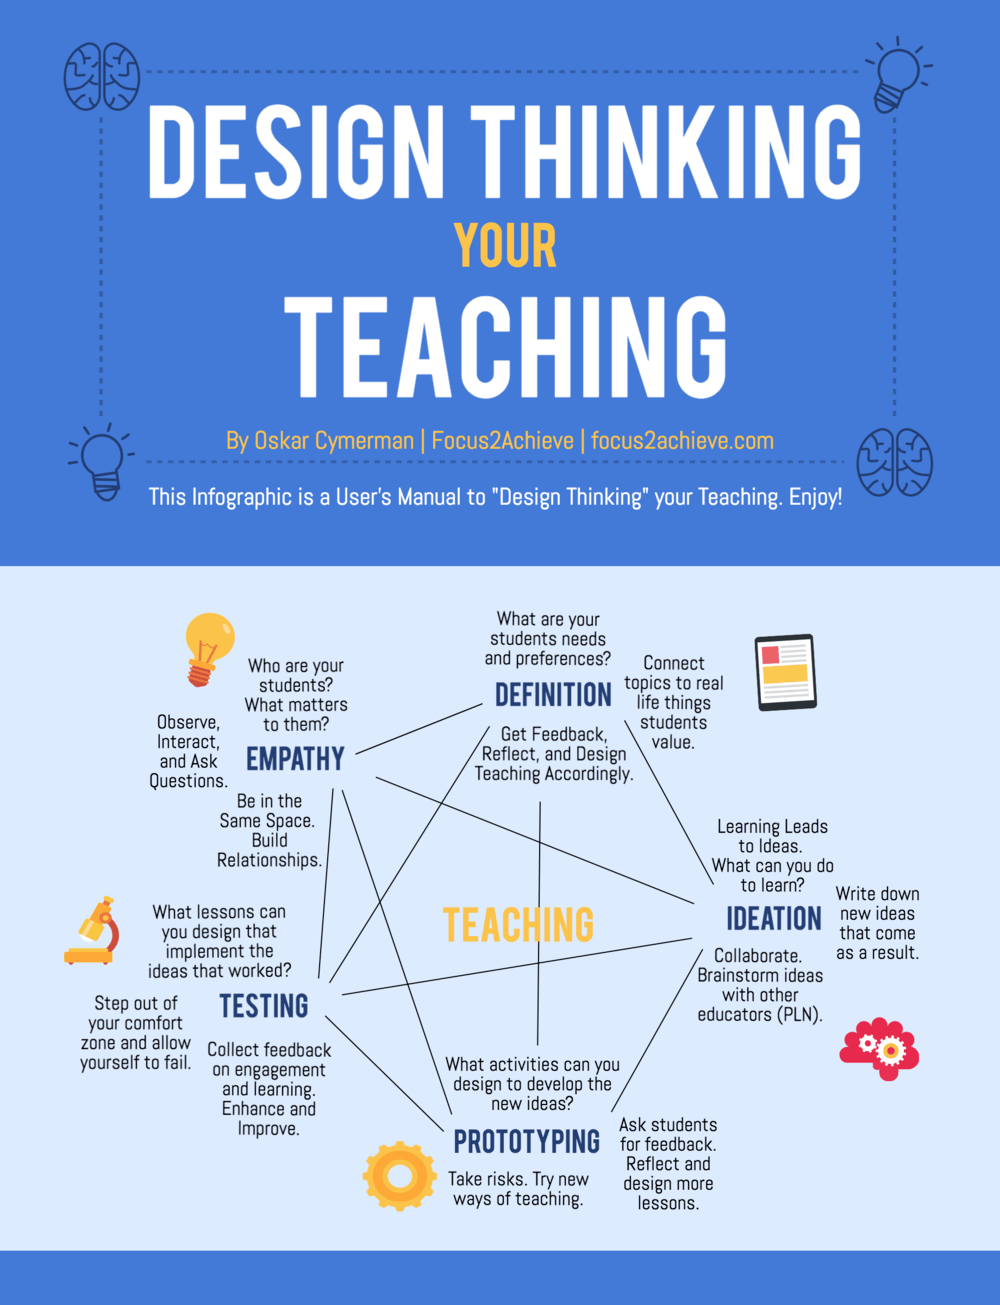
Design Thinking Your Teaching Infographic – E-Learning Infographics

elearninginfographics.com
elearninginfographics confession obsessed influencing strategies infographicnow instructional
12 Infographics For Class Ideas | Infographic, How To Create

www.pinterest.com
infographic infographics create viral rules will class effective stunning making want go do plan definitely ever help these
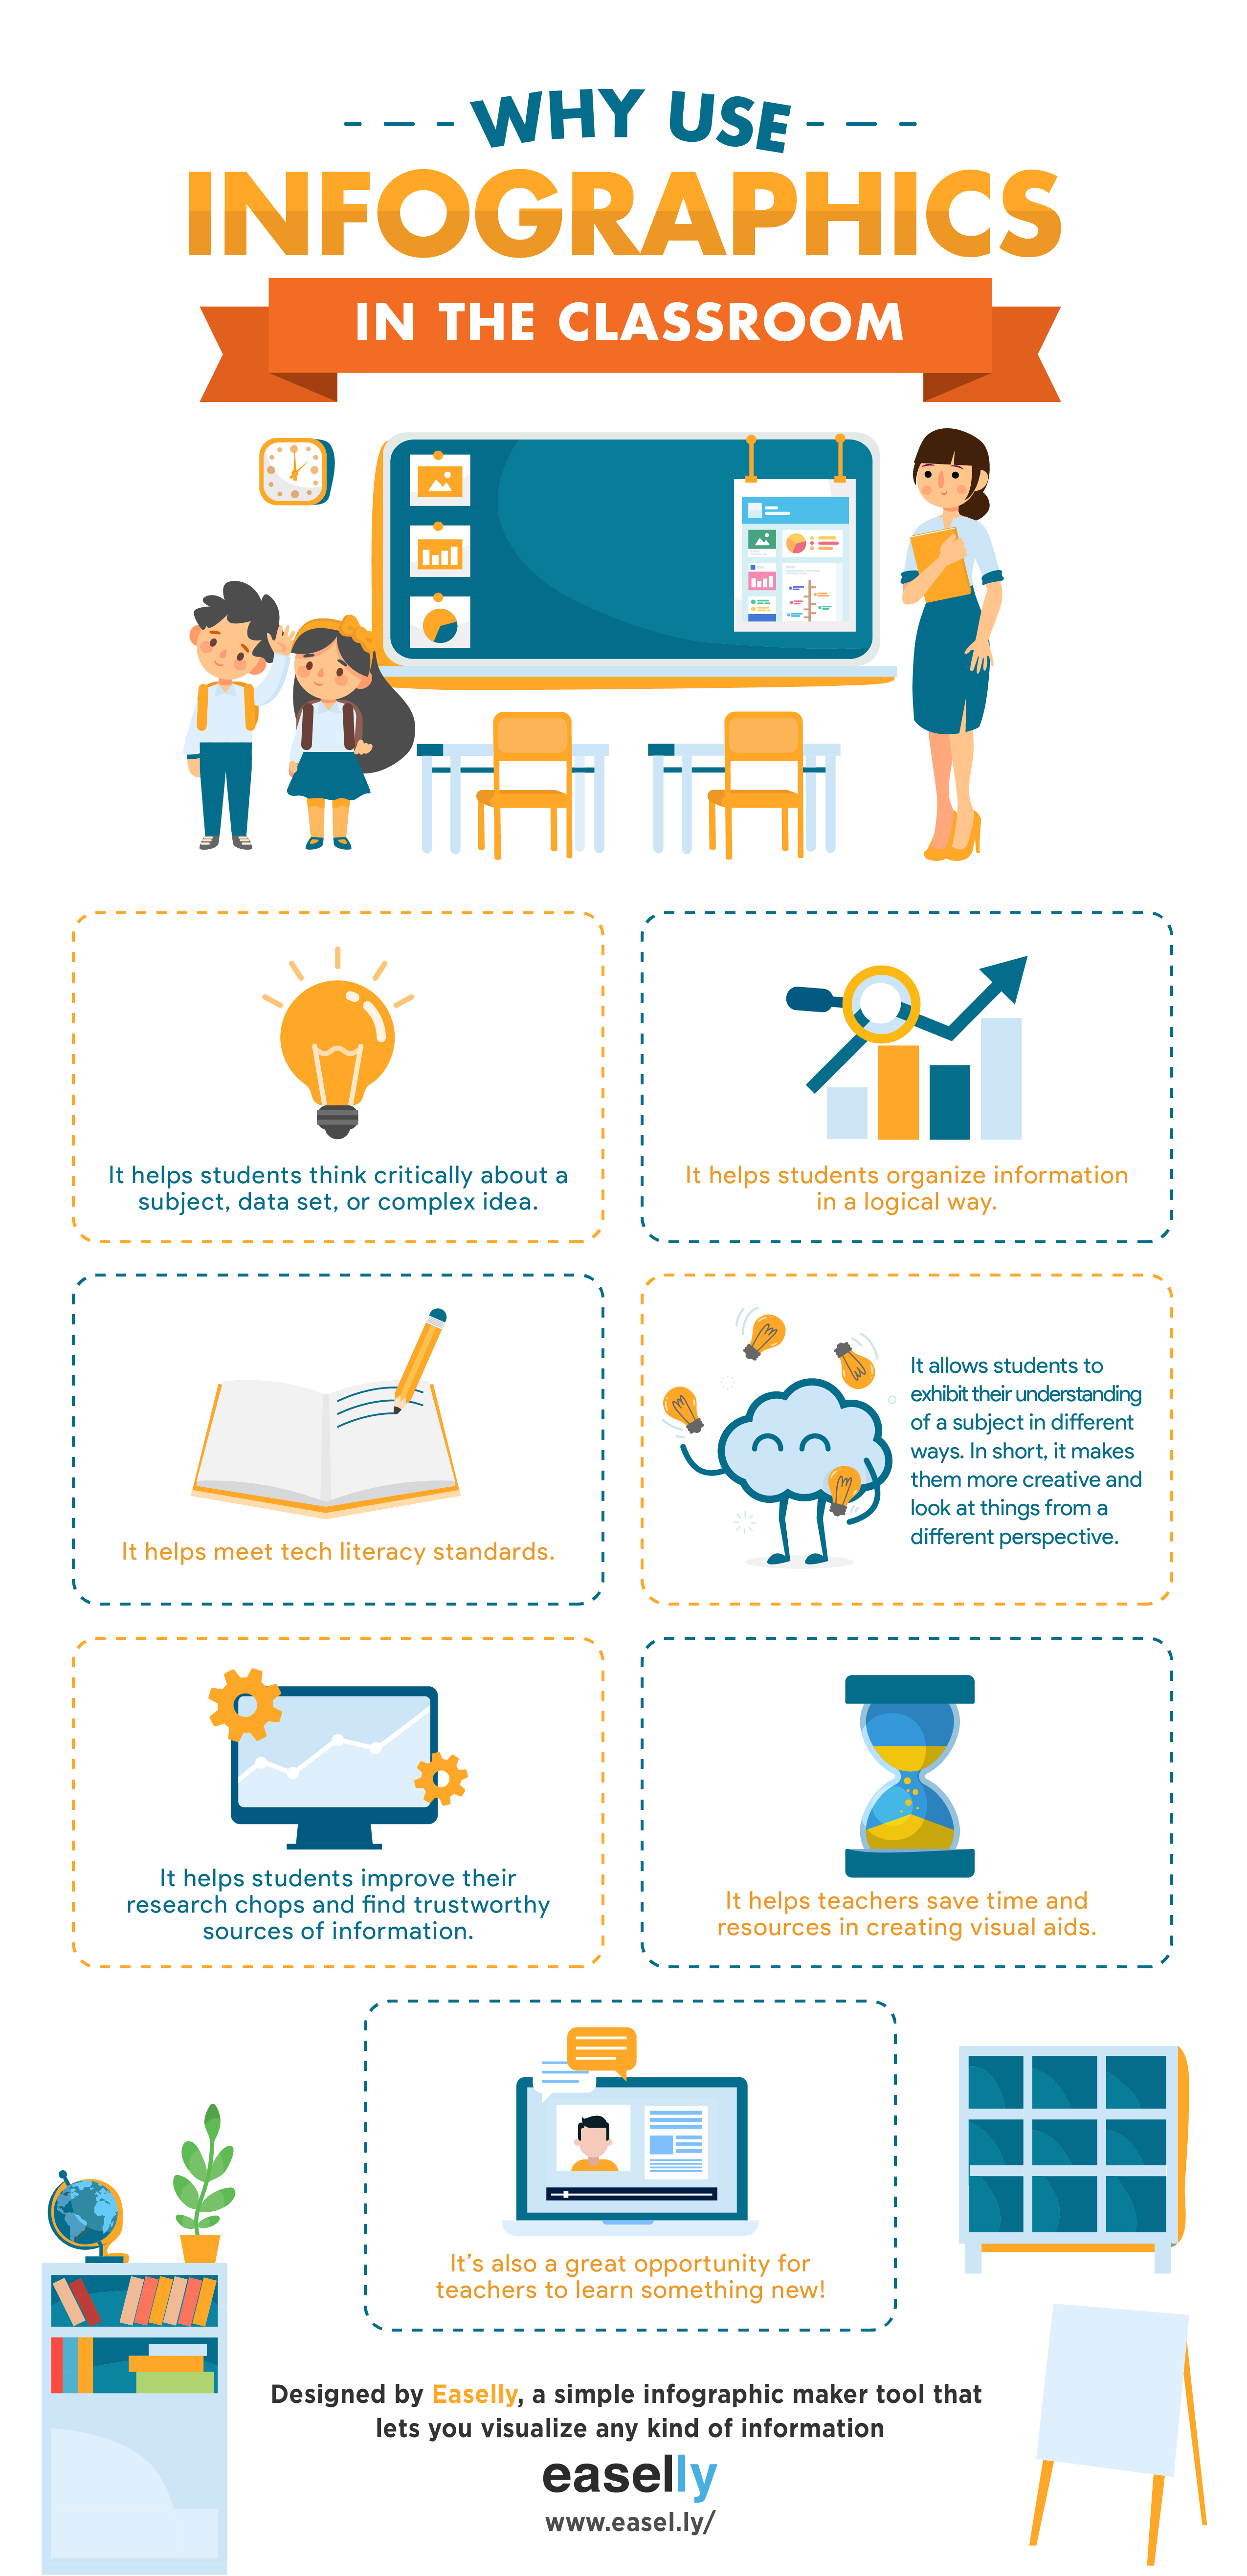
Infographic Explaining Infographics

ar.inspiredpencil.com
75+ New Creative Infographic Examples & Templates – Venngage

www.pinterest.com
infographic instructional
How Classroom Design Impacts Learning And Engagement Infographic – E

www.pinterest.com
Study Infographics Vector Design Timeline Concept Stock Vector (Royalty

www.shutterstock.com
Infographic explaining infographics. How classroom design impacts learning and engagement infographic. Infographic infographics create viral rules will class effective stunning making want go do plan definitely ever help these


