Infographics are revolutionizing the way we teach historical figures, making complex information accessible and engaging. By transforming historic timelines and key events into visually appealing graphics, both teachers and students can better grasp and retain valuable information. If you’re looking to elevate your teaching methods, learning about infographic creation is essential.
Crafting Infographics for Historical Teaching
Creating infographics for teaching about historical figures allows for a unique presentation of data that can captivate students’ attention. These visual tools simplify complex information, making it easier for learners to connect with the subject matter. Engaging visuals not only enhance the learning experience but also foster critical thinking and deeper understanding.
Connecting Through Visualization
Utilizing infographics helps to establish connections between historical figures and their influence on current events and culture. This method of teaching enriches discussions and encourages students to explore the backstory of influential individuals, creating a more rounded educational experience.
Optimal Timing for Infographic Use
Using infographics is particularly effective during project-based learning sessions or when introducing new historical topics. They offer a visual summary that can pique interest and serve as a springboard for further inquiry. Incorporating infographics in group discussions also invites collaborative learning, enriching the educational environment.
Enhancements to Learning Experiences
Integrating infographics into history lessons enhances retention of information, facilitates visual learning, and allows students to engage with material creatively. This approach can lead to higher levels of student satisfaction and motivation, resulting in a positive academic experience.
Frequently Asked Questions
- What tools can I use to create infographics? There are numerous online platforms available such as Canva, Piktochart, and Venngage that make infographic design simple and intuitive.
- How can infographics aid in historical research? Infographics help break down complex historical data into digestible visuals that highlight key points and themes quickly.
- Can I incorporate student feedback into my infographics? Absolutely! Incorporating student suggestions can enhance engagement and ensure the material resonates with the audience.
- Are there specific elements that should be included in historical infographics? Key dates, influential figures, significant events, and visuals that represent the historical context are essential for an effective infographic.
How to create infographics for teaching about historical figures
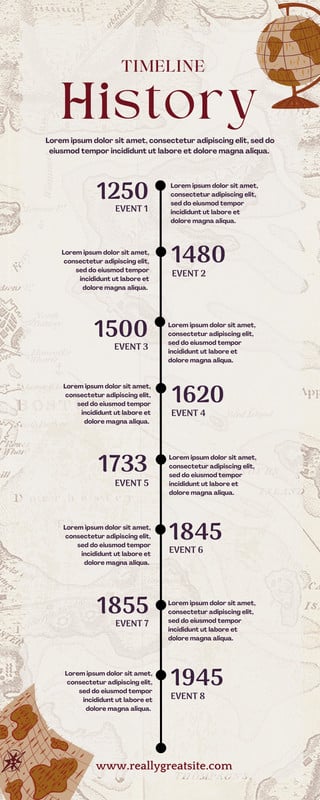
The target audience for infographics in teaching about historical figures includes teachers, students, and educational content creators. During my own journey of creating infographics for teaching, I found immense value in this format. For instance, when I designed an infographic on influential female figures in history, I used visually compelling timelines and bullet points to succinctly present key contributions. This enhanced the classroom discussion and allowed students to engage deeply with the material. One specific image I used was a sleek timeline, showcasing the accomplishments of historical figures, making it visually appealing and informative.  The satisfied reactions from students reinforced my belief in the effectiveness of infographics for educational purposes.
Final Thoughts on Infographics in History Education
Creating infographics for teaching about historical figures not only enriches educational experiences but also fosters a greater appreciation for history itself. By integrating visual tools into your teaching style, you pave the way for deeper understanding and a more interactive classroom environment. Embrace this innovative approach and watch your students’ enthusiasm for history thrive.
If you are searching about Teaching Historical Fiction with Reading Activities for Kids – Enjoy you’ve came to the right page. We have 10 Pics about Teaching Historical Fiction with Reading Activities for Kids – Enjoy like Infographics in Education: Easelly as an NYC Schools Tech Partner, Infographic Timeline Text and also Best-Economics-Infographic-Examples-history-of-money – support Visme. Here you go:
Teaching Historical Fiction With Reading Activities For Kids – Enjoy

enjoy-teaching.com
fiction historical teaching kids enjoy activities elements table reading genre history books they days enjoyed sneed several ms class article
Historical Infographic – Google Search | World History, Infographic

www.pinterest.com
infographics ten
Free Custom Printable Timeline Infographic Templates Canva | Lupon.gov.ph
www.lupon.gov.ph
School Teaching Infographics Royalty Free Vector Image

www.vectorstock.com
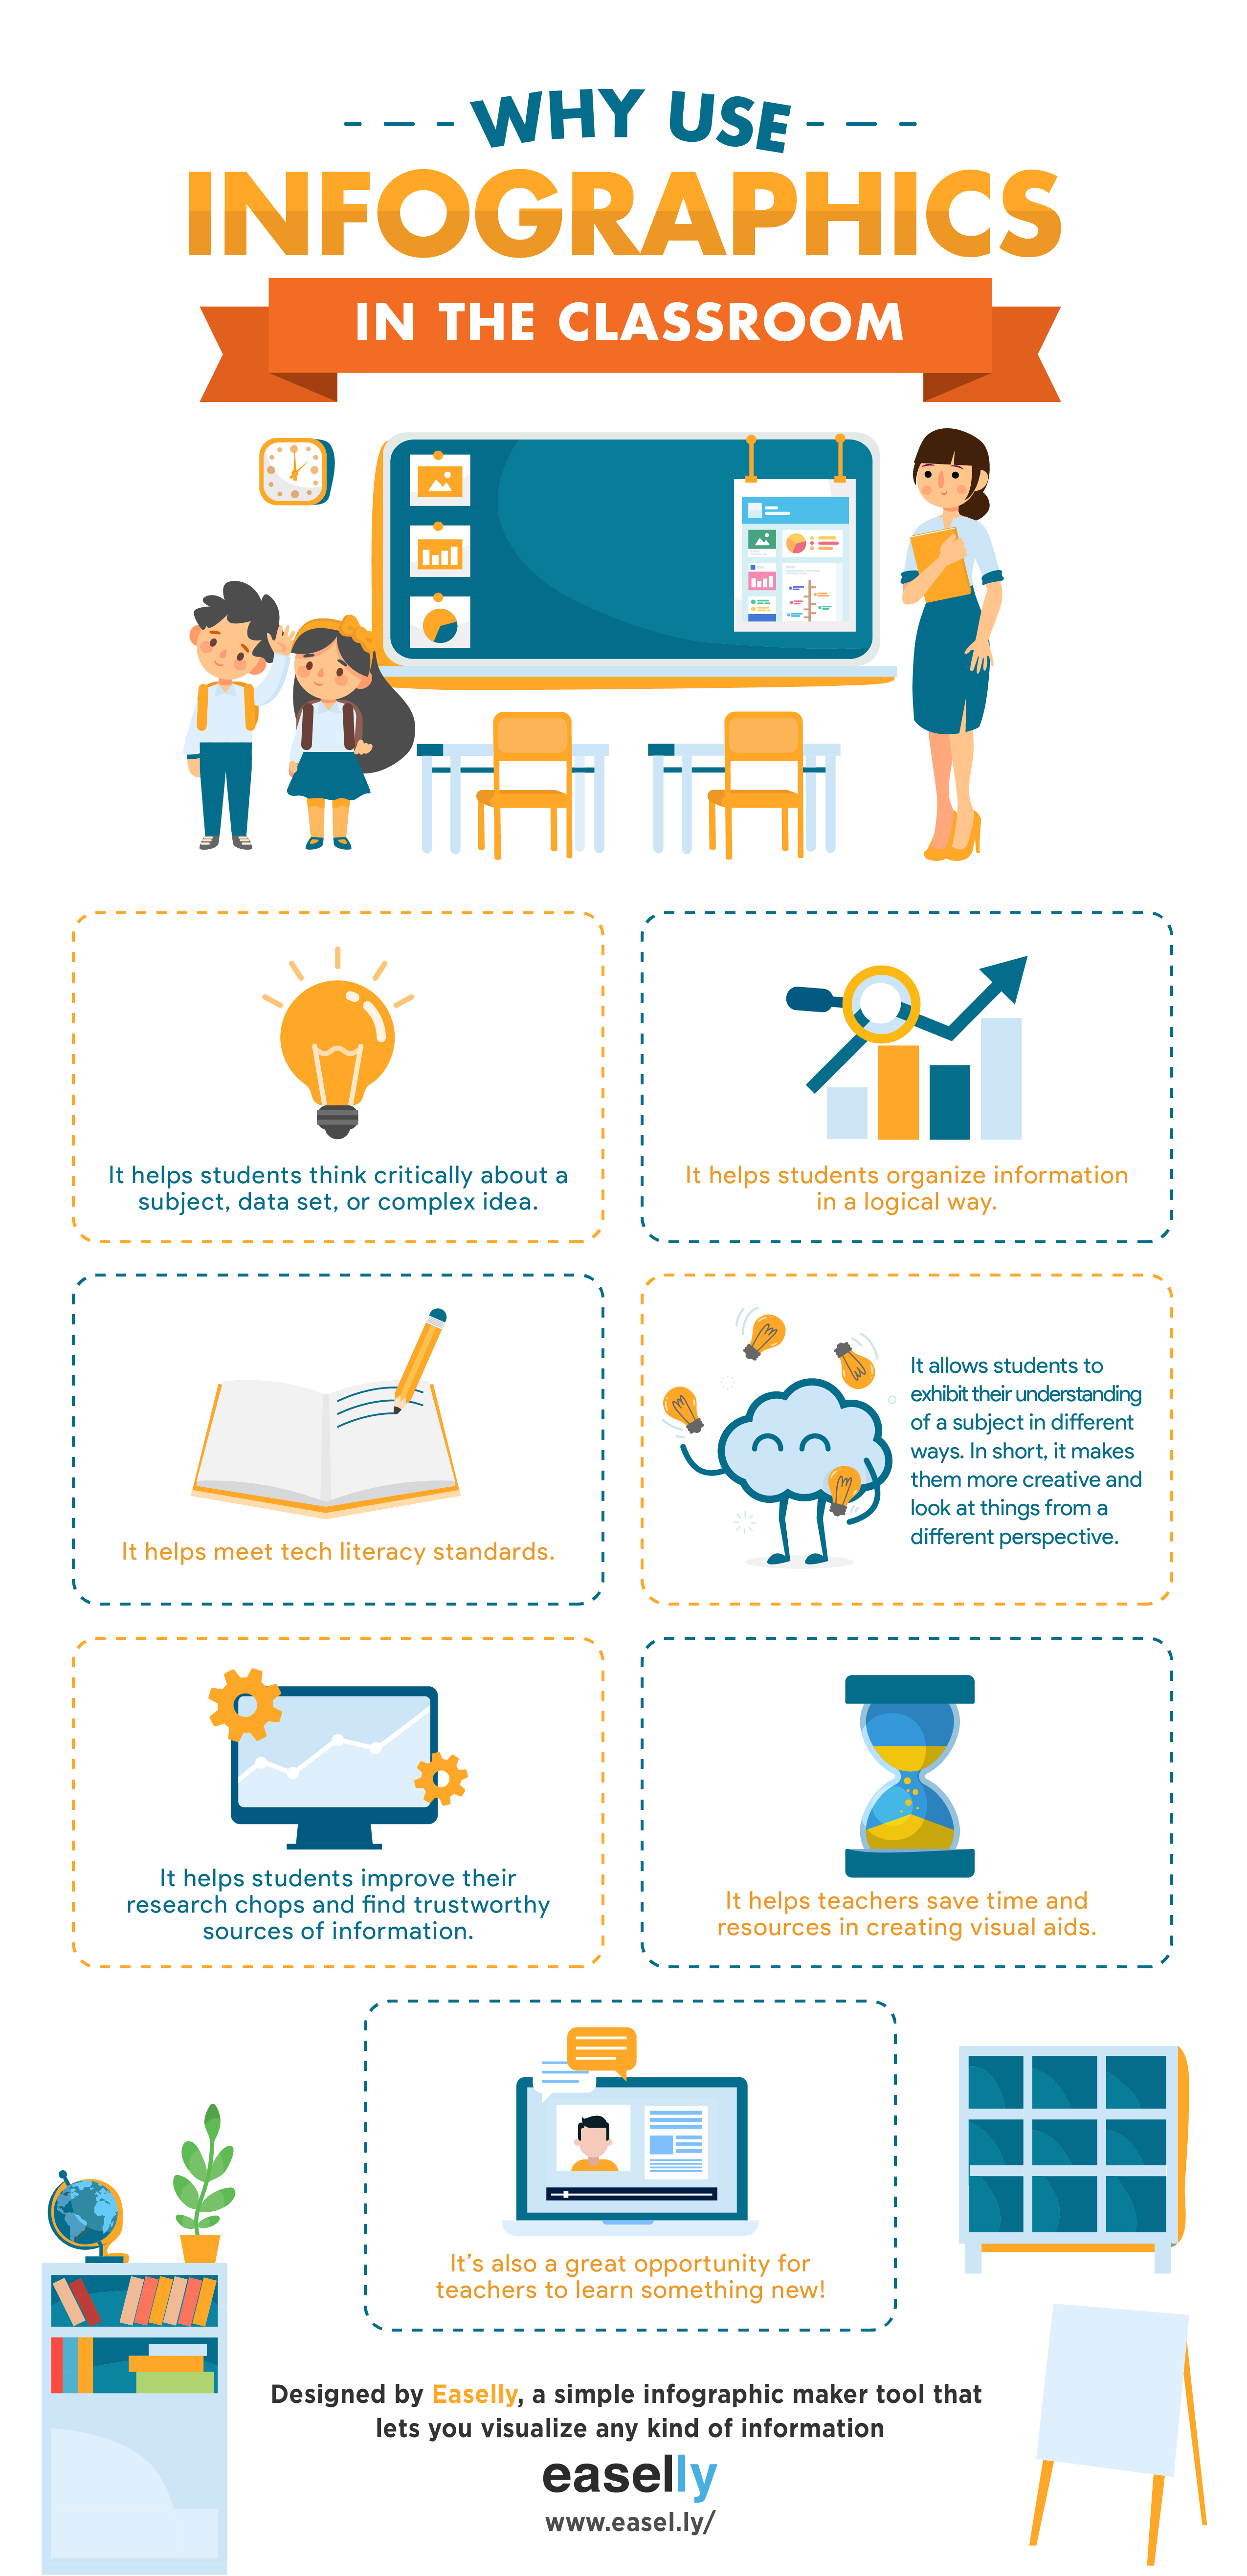
Infographics In Education: Easelly As An NYC Schools Tech Partner
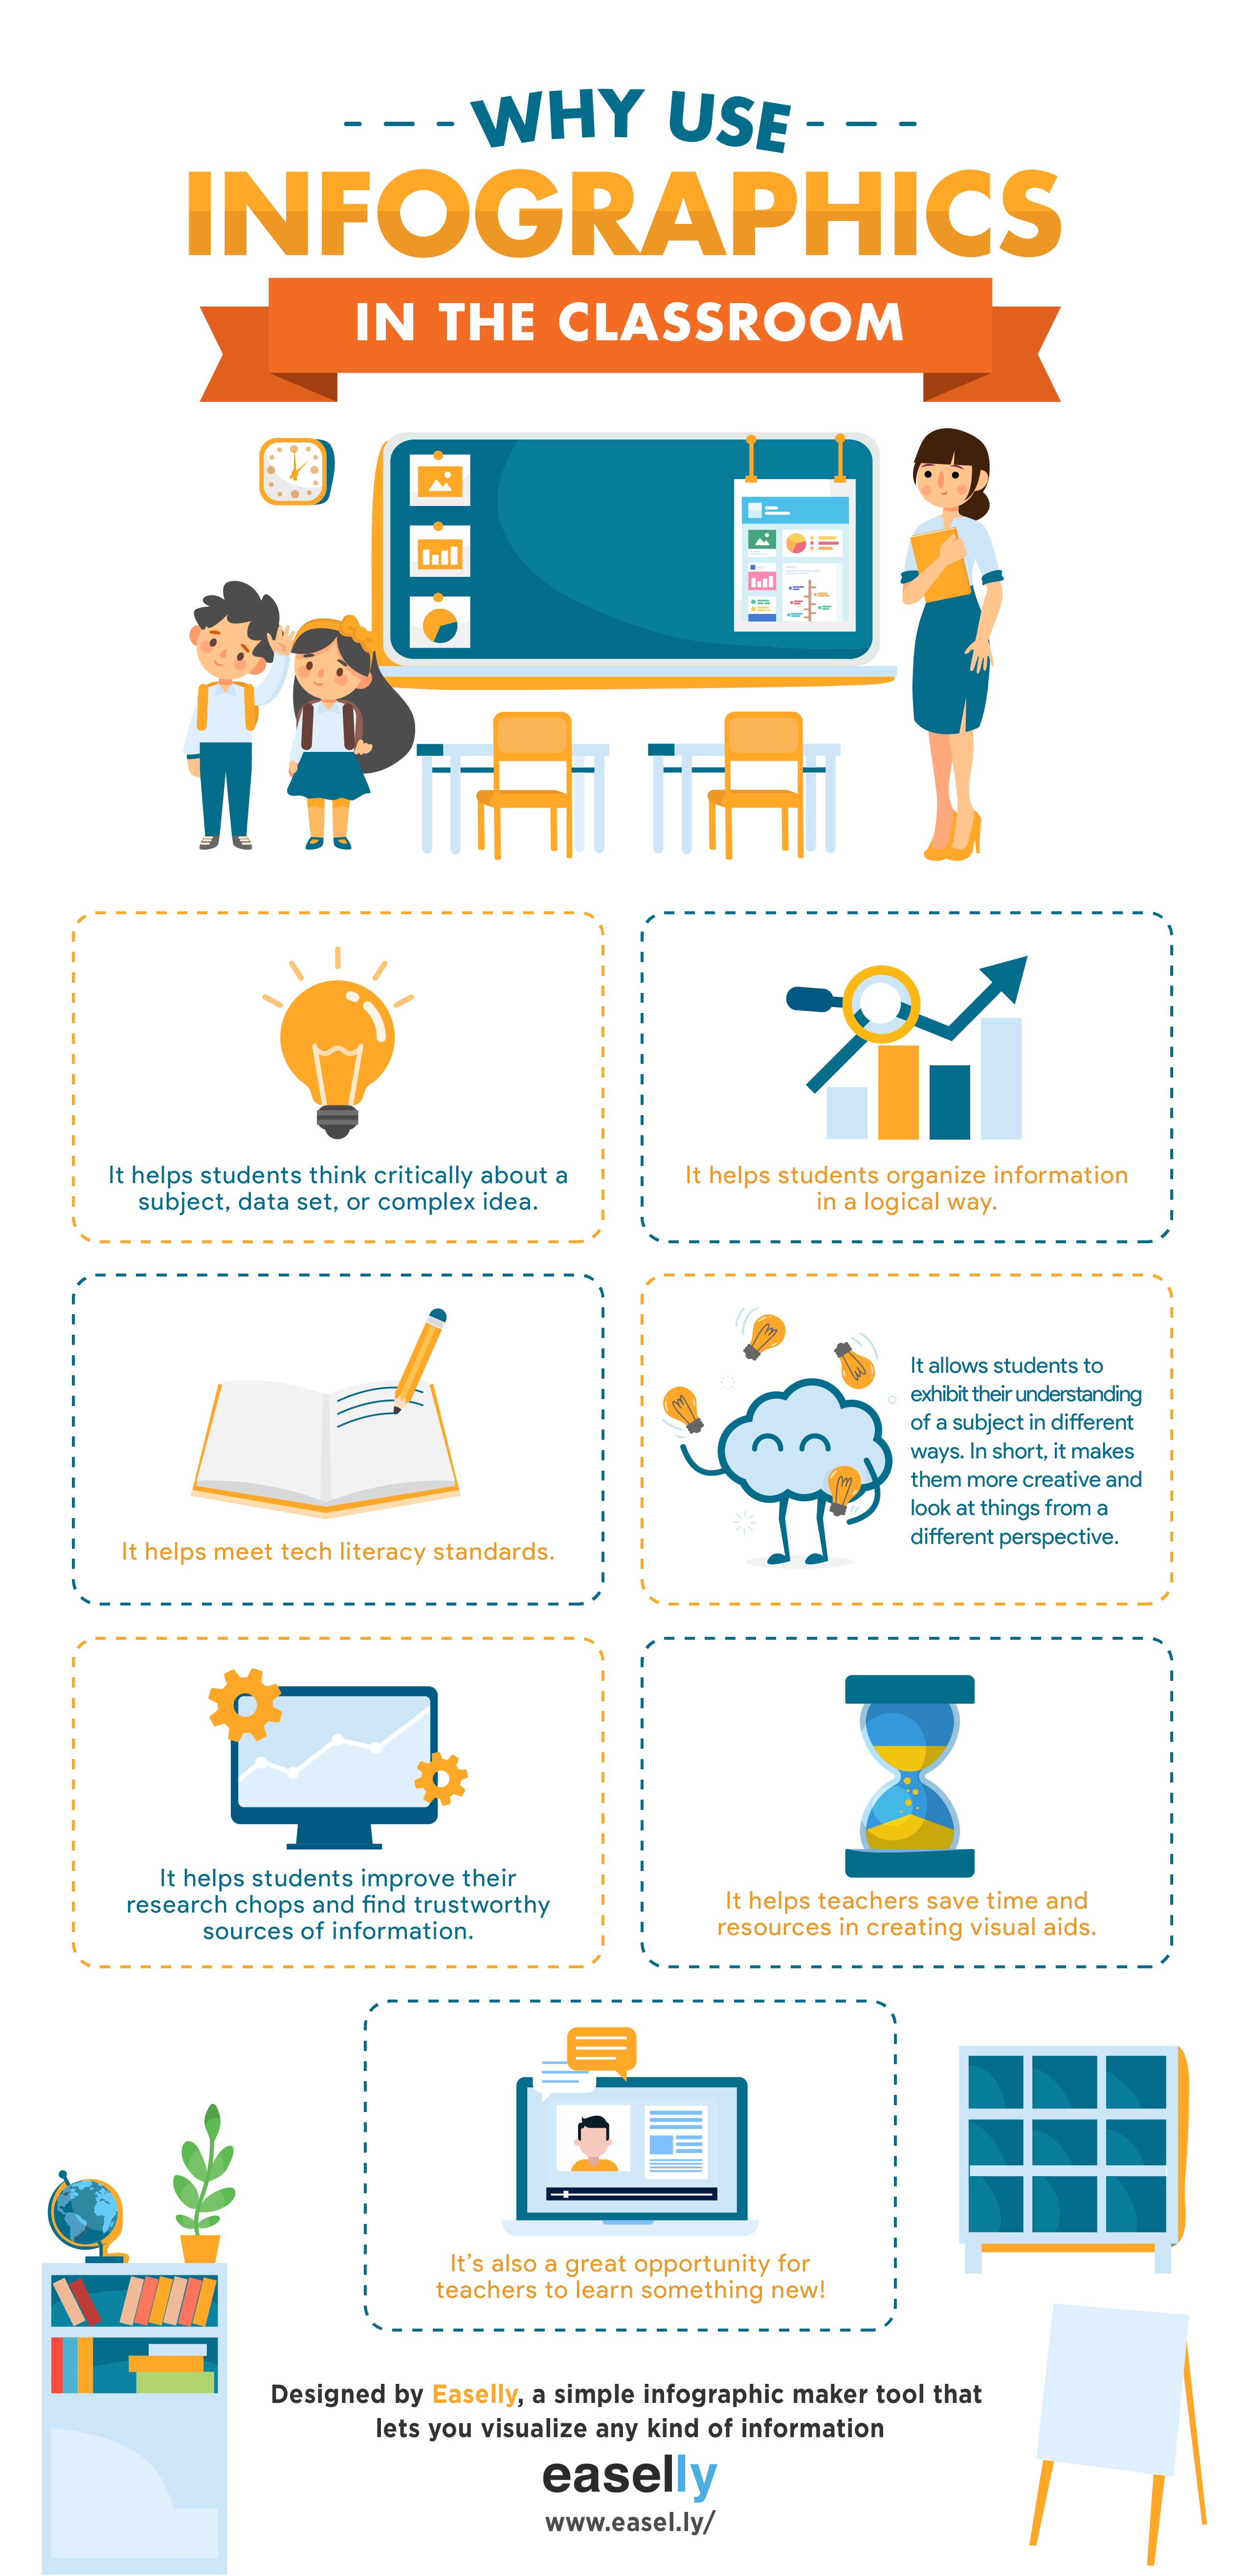
www.easel.ly
effective easelly learners easel educators batch asked
Infographics Timeline And History On Pinterest Timeli – Vrogue.co

www.vrogue.co
Best-Economics-Infographic-Examples-history-of-money – Support Visme

visme.co
economics visme infographics subjects
28 General Infographic Ideas | Infographic, Learn Culture, History

www.pinterest.com
History-of-life_52e2af53258a4_w1500

www.dailyinfographic.com
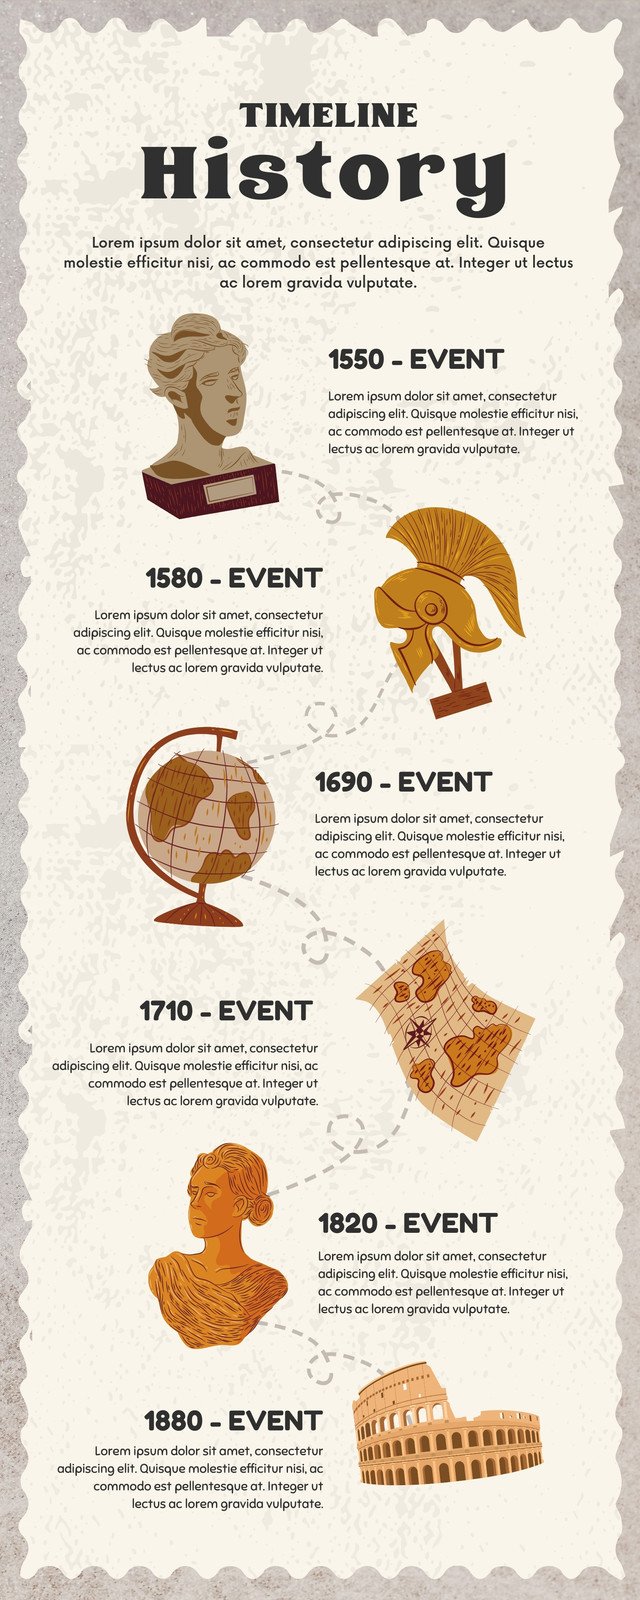
Infographic Timeline Text
ar.inspiredpencil.com
Teaching historical fiction with reading activities for kids. Effective easelly learners easel educators batch asked. Infographics ten

