In a world where environmental issues are at the forefront of public discourse, visual learning resources like infographics are essential tools for conveying complex information effectively. Infographics simplify important data, making it easier for learners of all ages to engage with and understand critical sustainability concepts.
Creating Infographics for Environmental Awareness
Crafting infographics focused on environmental sustainability enhances educational experiences, providing clear visual representations of statistics, processes, and impacts. By designing these visuals, educators can bridge the gap between abstract ideas and tangible actions that individuals and communities can take to promote sustainability.
The Role of Infographics in Education
Using infographics for teaching about environmental sustainability fosters a deeper understanding of ecological challenges. When learners see graphical representations of information, they are more likely to remember key points and feel empowered to act. These tools highlight the interconnectedness of nature and human activity, making the learning experience more relevant and impactful.
Optimal Times to Implement Infographics
Incorporating infographics in environmental education is particularly effective during specific events such as Earth Day, sustainability workshops, or environmental science classes. Engaging students during these occasions helps reinforce the concepts being taught and encourages discussions that lead to meaningful action.
Gaining Insights Through Infographic Design
Utilizing infographics facilitates the communication of essential information in a way that resonates with learners. The visual appeal of an infographic can capture attention and generate interest, motivating individuals to explore further into sustainable practices and the importance of their choices on the environment.
Frequently Asked Questions
- What tools can I use to create infographics? You can use online tools such as Canva, Piktochart, or Adobe Spark, which offer user-friendly templates for designing infographics.
- What topics should I focus on for an environmental infographic? Topics such as recycling processes, the impact of pollution, renewable energy, and sustainable practices are excellent choices for an infographic.
- How can I measure the effectiveness of my infographic? You can gauge effectiveness through feedback surveys, monitoring engagement statistics, and evaluating improvements in knowledge retention.
- Can infographics be used in online education? Absolutely! They are perfect for online courses as they can articulate complex data in a concise and engaging format.
How to Create Infographics for Teaching about Environmental Sustainability
The target of creating infographics for teaching about environmental sustainability is to engage learners and inspire them to take action. In my personal experience, I created an infographic that highlighted the effects of plastic pollution on marine life. This project involved researching statistics, designing visual elements, and drafting a clear message. It was gratifying to see students not only respond positively to the infographic but also initiate discussions on reducing plastic waste in our school community. Incorporating images of the infographic, such as the one showcasing the lifecycle of plastics, enhanced the overall impact of the message.


Insights on Infographics for Environmental Education
When I began my journey in creating infographics, I realized their power in making complex topics accessible. One specific project focused on illustrating the process of urban composting, showing steps from kitchen waste to nutrient-rich soil. The visual representation engaged my audience, sparking interest and motivating them to start their composting journey. This transformative experience demonstrates that well-designed infographics can educate and inspire action toward a sustainable future.
Closing Thoughts on Infographics for Environmental Sustainability
Designing infographics serves not only as a method of conveying crucial knowledge about environmental sustainability but also as a pathway to inspire change. As we continue to develop these visual tools, we contribute to a more informed and engaged community. With every infographic created, we take a step toward a sustainable future.
If you are looking for Green Hat Sustainability Infographics – Green Hat you’ve came to the right place. We have 10 Images about Green Hat Sustainability Infographics – Green Hat like Environmental awareness – infographic – HOW TO PROMOTE ENVIRONMENTAL, SDG Links Infographic | Sustainable development, Sustainable and also 1000+ images about Sustainability on Pinterest | Circular economy. Read more:
Green Hat Sustainability Infographics – Green Hat
greenhat.studio
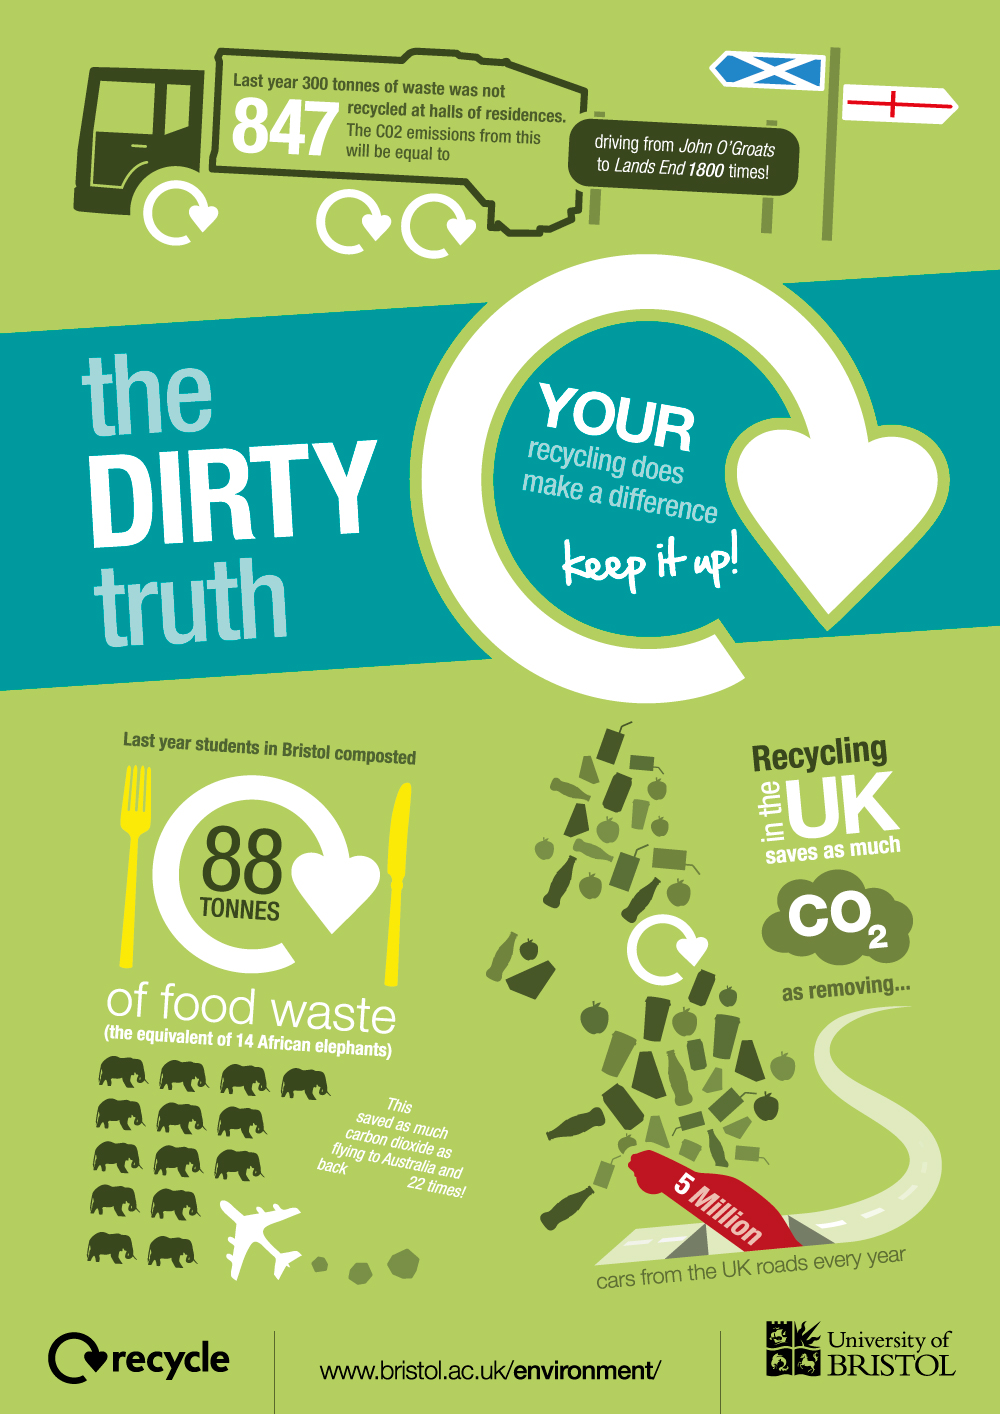
infographics sustainability sustainable recycle change bristol students transport
Trees #infographicdesigninspiration Infographic About Trees. Made To
www.pinterest.es
infographic ecological ecology shauna auswählen
INFOGRAPHIC: The Benefits Of Sustainable Engineering
inhabitat.com
engineering sustainable infographic benefits building featured videos our
SDG Links Infographic | Sustainable Development, Sustainable
www.pinterest.fr
sdg infographic sustainable sostenible objetivos infographics 2030 dashboard framework unep frameworks ods unctad sustentable iconos medioambiente onu
Environmental Awareness – Infographic – HOW TO PROMOTE ENVIRONMENTAL
www.studocu.com
1000+ Images About Sustainability On Pinterest | Circular Economy
www.pinterest.com
infographics infographic environmental sustainability environment carbon footprint visit recycle
The Top 6 Sustainability Infographics Of 2012
conversations.marketing-partners.com
carbon footprint emissions infographics sustainability per infographic country capita stanford kay map co2 marketing footprints top tracking world nation graphics
U.S. Farmers & Ranchers Alliance Unveils Animated Video And
markets.financialcontent.com
infographics ranchers farms unveils emphasizing ranches wholly checkoff partially funded
St. Thomas Uses Sustainability Week As Teaching Tool – TommieMedia
www.tommiemedia.com
A Growing Interest In Sustainable Products – Infographic – MSP Design Group
mspdesigngroup.com
U.s. farmers & ranchers alliance unveils animated video and. Infographic: the benefits of sustainable engineering. The top 6 sustainability infographics of 2012


