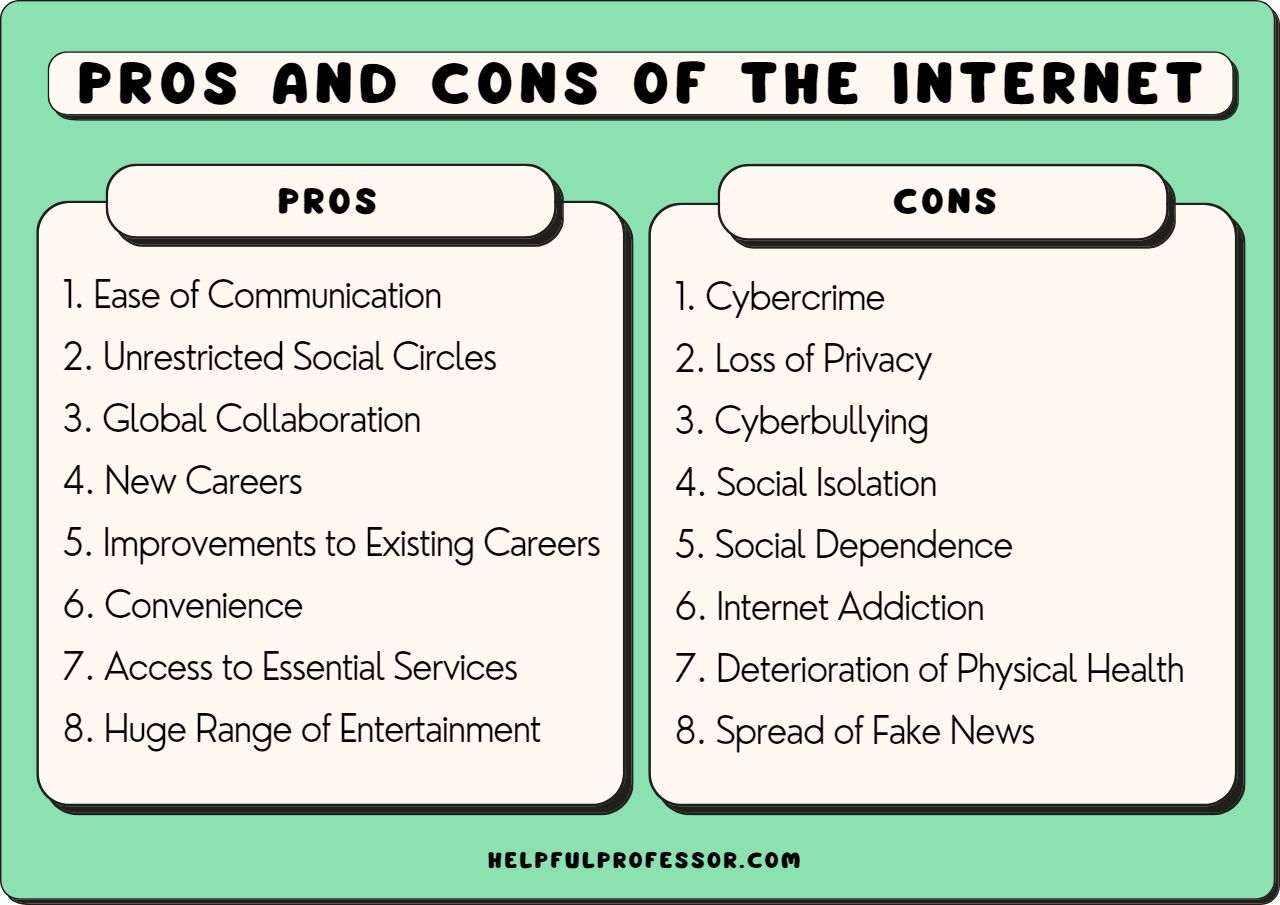
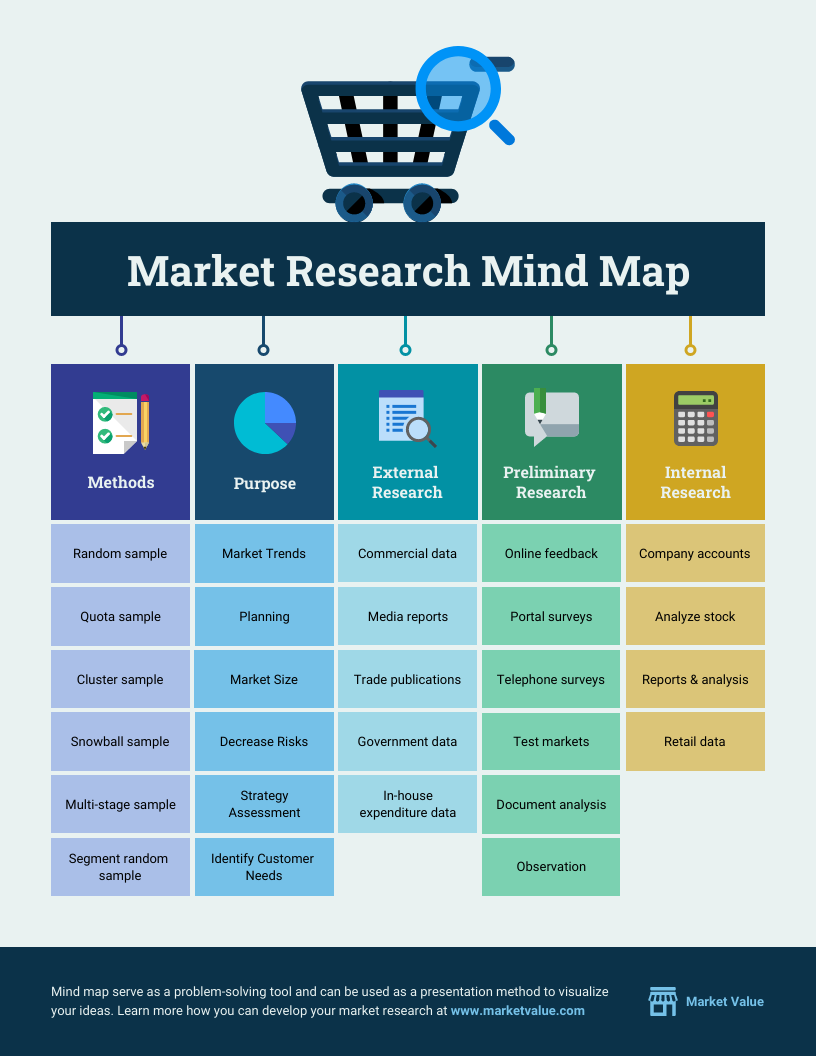
In a world overflowing with information, how do educators transform complex cultural and historical topics into engaging and comprehensible formats? Infographics stand out as a compelling solution that not only simplifies data but also captivates students’ attention. Whether you are teaching in a classroom setting or conducting workshops, learning to create infographics can serve as a powerful teaching tool.
Emphasizing creativity and clarity
Creating infographics for cultural and historical topics fosters creativity while enhancing clarity in communication. This visual representation aids in breaking down intricate data into digestible pieces, making it easier for learners to grasp key concepts and retain the information. Infographics build a bridge between factual content and artistic expression, creating a holistic learning experience.
Enhancing retention through visuals
Visual learning is proven to enhance memory retention. By integrating graphics, colors, and various formats, educators can increase engagement levels. This approach not only meets the diverse learning styles of students but also stimulates interest in subjects that may otherwise seem mundane. Infographics have the unique ability to transform statistics and facts into narratives that resonate with learners.
Timing and setting for infographic implementation
The use of infographics is most effective during specific educational moments, such as introducing new topics or summarizing lessons. They can serve as excellent visual aids during lectures, group discussions, or presentations, helping to consolidate information. Additionally, using infographics as part of homework assignments allows students to creatively express their understanding of the subject matter at their own pace.
Encouraging collaborative learning
Engaging students in the process of creating their own infographics encourages collaboration and interaction. When students work in teams, they learn to share perspectives and ideas, fostering a sense of community. This collaborative effort not only enhances their understanding of cultural and historical themes but also builds crucial skills such as communication and teamwork.
Frequently Asked Questions
What tools are best for creating infographics?
Several user-friendly tools like Canva, Piktochart, and Adobe Spark are excellent for educators looking to create infographics without needing advanced design skills.
Are there specific guidelines for designing effective infographics?
Yes! Ensuring a clear layout, consistent color schemes, and using easy-to-read fonts contributes to the overall effectiveness of the infographic.
Can infographics be adapted for different age groups?
Absolutely! Infographics can be tailored to suit various age groups by adjusting complexity and the type of visuals used.
How can I assess students’ understanding when using infographics?
Educators can assess understanding through discussions, quizzes, or asking students to create their own infographics based on topics discussed in class.
How to create infographics for teaching about cultural and historical topics
This approach targets educators who wish to enrich their teaching methods. A personal experience I had while creating an infographic about world culture showcased the power of visuals. I used platforms like Canva to integrate information about different ethnicities, traditions, and languages, accompanied by images that resonated with the content.
![]()
The result was a vibrant and informative piece that sparked dialogue and interest among my students. They were able to visualize the rich tapestry of global cultures while improving their understanding of the importance of this diversity in historical contexts.
Final thoughts on creating infographics for teaching about cultural and historical topics
Utilizing infographics in education can significantly impact how students learn about cultural and historical topics. By making information visually accessible and engaging, educators can foster a more inclusive and effective learning environment. Embracing this method encourages creativity, collaboration, and a deeper understanding of diverse subject matter, paving the way for enriched educational experiences.
If you are searching about Educational infographic : "culture" – InfographicNow.com | Your Number you’ve came to the right place. We have 10 Images about Educational infographic : "culture" – InfographicNow.com | Your Number like Korea infographic concept flat style Royalty Free Vector, Culture | Teaching culture, Teaching social studies, What is culture and also What is Organizational Culture? (INFOGRAPHIC) | Organizational. Here it is:
Educational Infographic : "culture" – InfographicNow.com | Your Number
infographicnow.com
Round Infographics Images | Free Vectors, Stock Photos & PSD
www.freepik.com
infographics round culture ethnicity save
Culture | Teaching Culture, Teaching Social Studies, What Is Culture
www.pinterest.pt
culture prek classroom visit multicultural would make cultural
View Workplace Infographic Examples Pictures | Twoinfographic
twoinfographic.blogspot.com
filipino filipinos navigating
Art And Culture Blog
nadjah5a.blogspot.com
infographic
Infographic Definition Of Culture And Society
ar.inspiredpencil.com
How To Create Infographics For Teaching & Learning – American TESOL
americantesol.com
infographics teaching learning piktochart create infographic tesol american institute road using march classroom education april
Page 8 | Brazil Images – Free Download On Freepik
www.freepik.com
What Is Organizational Culture? (INFOGRAPHIC) | Organizational
www.pinterest.com.au
Korea Infographic Concept Flat Style Royalty Free Vector
www.vectorstock.com
Educational infographic : "culture". Infographic definition of culture and society. How to create infographics for teaching & learning


