In a world overflowing with data and complex scientific concepts, the ability to communicate effectively becomes crucial. Visual representation through infographics serves as a bridge, making intricate processes understandable and accessible to a broader audience. Engaging with these visual tools not only enhances learning but also fosters curiosity in scientific exploration.
The Necessity of Visual Tools for Clarity
Creating compelling infographics to explain scientific processes allows educators, researchers, and students to distill complex ideas into digestible formats. Infographics transform text-heavy content into visual stories through charts, diagrams, and illustrations. The simplicity of design coupled with the depth of information ensures that essential scientific principles are clearly conveyed without overwhelming the audience.
The Role of Infographics in Education and Communication
Utilizing infographics effectively enhances comprehension and retention of scientific information. Visual aids cater to varied learning styles, offering interactive learning experiences that engage visual learners and foster better understanding among all individuals. They also enable quick reference points, making it easier for individuals to revisit concepts without sifted through dense text.
Optimal Scenarios for Crafting Informative Infographics
Infographics shine during presentations, educational workshops, or when disseminating research findings. They can be strategically employed at the beginning of a lesson to introduce topics or as summary tools at the end. Furthermore, in today’s digital era, sharing infographics through social media platforms, blogs, and educational websites maximizes their reach and impact.
Advantages of Utilizing Infographics in Scientific Communication
Visual representation plays a significant role in sparking interest and enthusiasm in scientific topics. By breaking down complex processes into visually appealing designs, infographics make information easier to grasp and recall. They also serve as powerful tools for advocacy, helping to illustrate the significance of scientific research and promote public understanding.
Frequently Asked Questions
1. How do infographics enhance learning in science?
Infographics condense information visually, catering to different learning styles and improving comprehension and retention by making complex concepts simpler.
2. What tools can I use to create scientific infographics?
There are several user-friendly tools available such as Canva, Piktochart, and Venngage that allow users to design infographics easily.
3. Are infographics useful for all age groups?
Yes, infographics are versatile and can be tailored to suit various audiences, from school children to advanced researchers, making them a valuable asset in education.
4. Where can I share my infographics once designed?
You can share infographics through social media, educational websites, academic platforms, and blogs to reach a wider audience effectively.
Designing Infographics to Explain Scientific Processes – Target Audience
My journey into designing infographics to explain scientific processes began during my time in graduate school. I realized how powerful visual communication could be in conveying intricate scientific methodologies and results. While preparing for a class presentation, I created an infographic using Venngage that illustrated the steps of the scientific method. The positive feedback I received was overwhelming, as my peers found the visual format more engaging than traditional presentation methods. By sharing my infographic on platforms like Pinterest, I discovered the broader appeal of visual learning among educators and students alike. 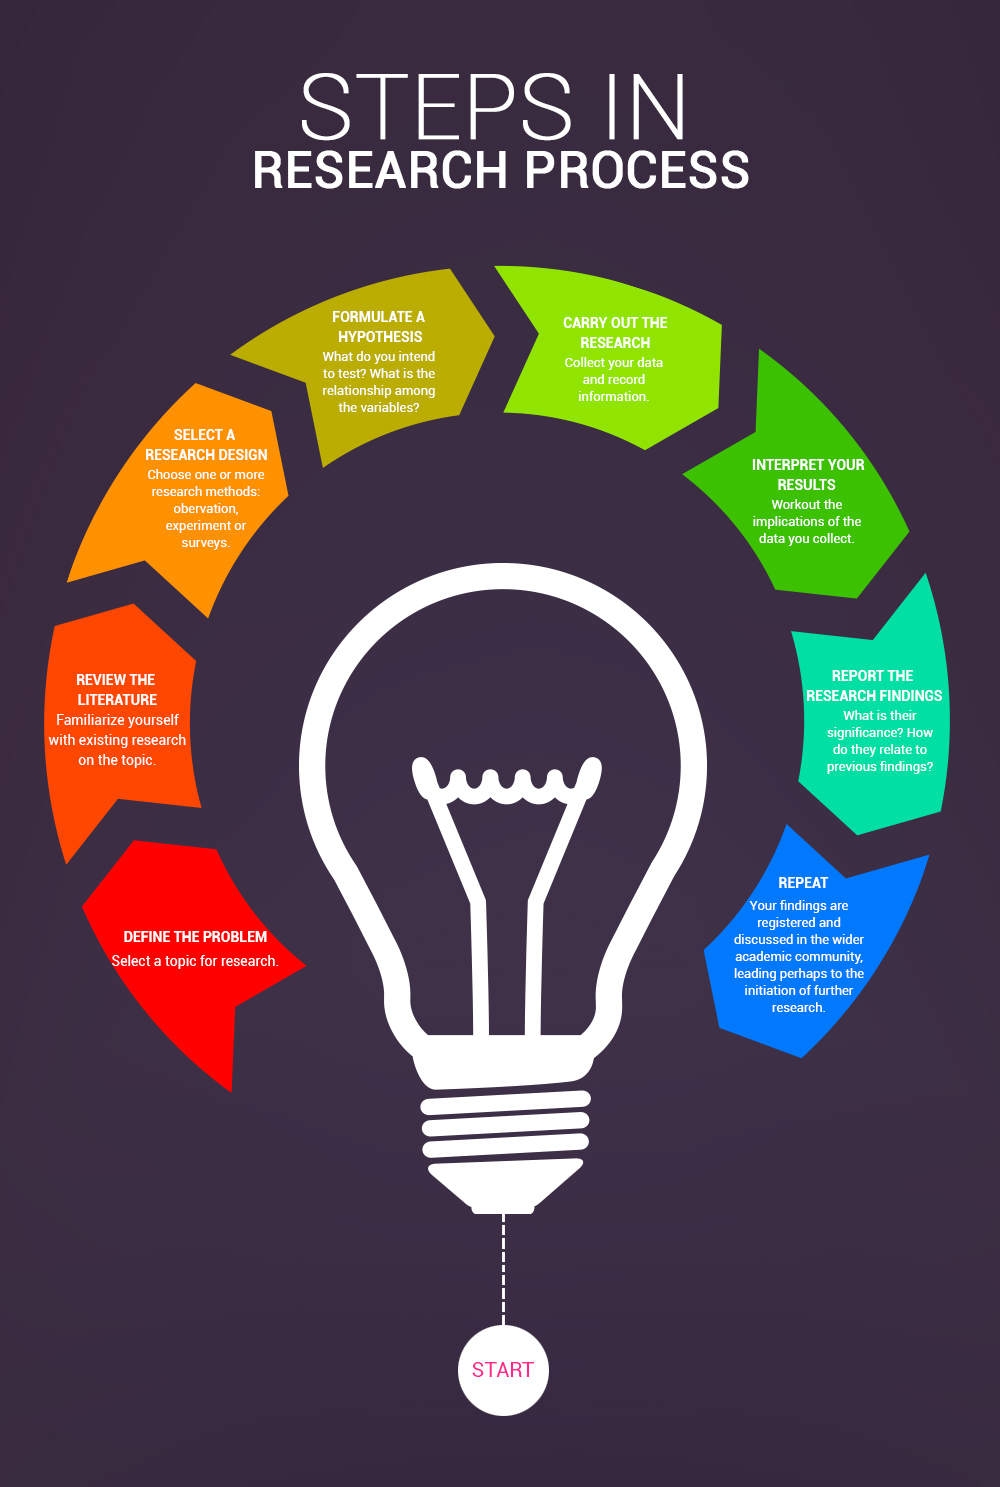 This experience reinforced my belief in the effectiveness of infographics to explain scientific processes and foster learning.
Wrap-Up of Designing Infographics to Explain Scientific Processes
Crafting infographics to elucidate scientific processes can transform how we communicate complex ideas and data. By simplifying information and making it visually engaging, infographics not only enhance understanding but also stimulate interest in the sciences. Embracing this method of communication offers both learners and educators the opportunity to explore and appreciate the beauty of science through a fresh lens.
If you are looking for Research Process: 8 Steps in Research Process you’ve visit to the right place. We have 10 Images about Research Process: 8 Steps in Research Process like A new way of thinking about the natural world based on careful, Die wissenschaftliche Methode: Schritte und Prinzipien – Venngage and also Research Process: 8 Steps in Research Process. Here it is:
Research Process: 8 Steps In Research Process
www.iedunote.com
process social sociology merits
Infographics Description
ar.inspiredpencil.com
The 6-Step Scientific Method Infographic Template – Venngage
venngage.com
infographic venngage infographics experiments
Steps Of Research Process
www.animalia-life.club
Instant Download Science Infographics Presentation
www.slideegg.com
Die Wissenschaftliche Methode: Schritte Und Prinzipien – Venngage
de.venngage.com
The Scientific Method | Free Infographic Template – Piktochart
piktochart.com
A New Way Of Thinking About The Natural World Based On Careful
gambarsaepnr.blogspot.com
explaining experiment pbs observations
Scientific Method Chart | Science Fair Projects, Science Fair
www.pinterest.co.uk
Easiest Way To Design Science Infographics – Edraw
www.edrawsoft.com
easiest
The 6-step scientific method infographic template. Process social sociology merits. Explaining experiment pbs observations