In the evolving landscape of education, infographics have emerged as powerful tools to enhance interactive learning, especially in the field of science. By transforming complex concepts into visually engaging materials, designers can capture students’ attention and facilitate better understanding.
Creating Engaging Learning Experiences
Designing infographics for supporting interactive learning in science education is essential for educators aiming to enhance student engagement. Infographics simplify intricate scientific information, enabling learners to grasp essential concepts quickly. These visual representations spark curiosity and invite students to explore topics more deeply, fostering a love for learning.
Significance of Visual Learning Tools
Effective communication of scientific data is crucial in the modern classroom. Engaging infographics not only attract attention but also improve retention rates among students. By presenting information in a digestible format, educators can ensure that learners understand and remember key scientific principles that are often challenging to convey through traditional text-based methods.
Optimal Timing for Infographic Usage
Integrating infographics into lessons is particularly advantageous during stages of new topic introductions or reviews. It’s beneficial to employ these visual aids when tackling complex subjects like biology or chemistry, where visualizing processes or relationships can significantly enhance comprehension. Moreover, during collaborative projects, infographics can support peer-to-peer learning by providing clear, concise information.
Enhancing Understanding and Collaboration
Using well-designed infographics in science education can lead to improved collaboration among students. They encourage group discussions as individuals interpret and analyze the visual data together. This sharing of perspectives promotes a deeper understanding of the subject matter and helps build critical thinking skills, crucial for scientific inquiry.
Frequently Asked Questions
Q1: How can infographics be effectively integrated into science lessons?
A1: Infographics can be integrated by presenting them during lectures, using them as handouts, or including them in digital learning platforms. They can also serve as prompts for discussions or group activities.
Q2: What tools are recommended for creating infographics?
A2: Tools like Canva, Piktochart, and Adobe Spark are popular for creating engaging infographics due to their user-friendly interfaces and diverse templates.
Q3: Can infographics support assessments in science education?
A3: Yes, infographics can be used for both formative and summative assessments, allowing students to present their understanding of a topic visually and creatively.
Q4: Are there specific science topics that benefit more from infographic use?
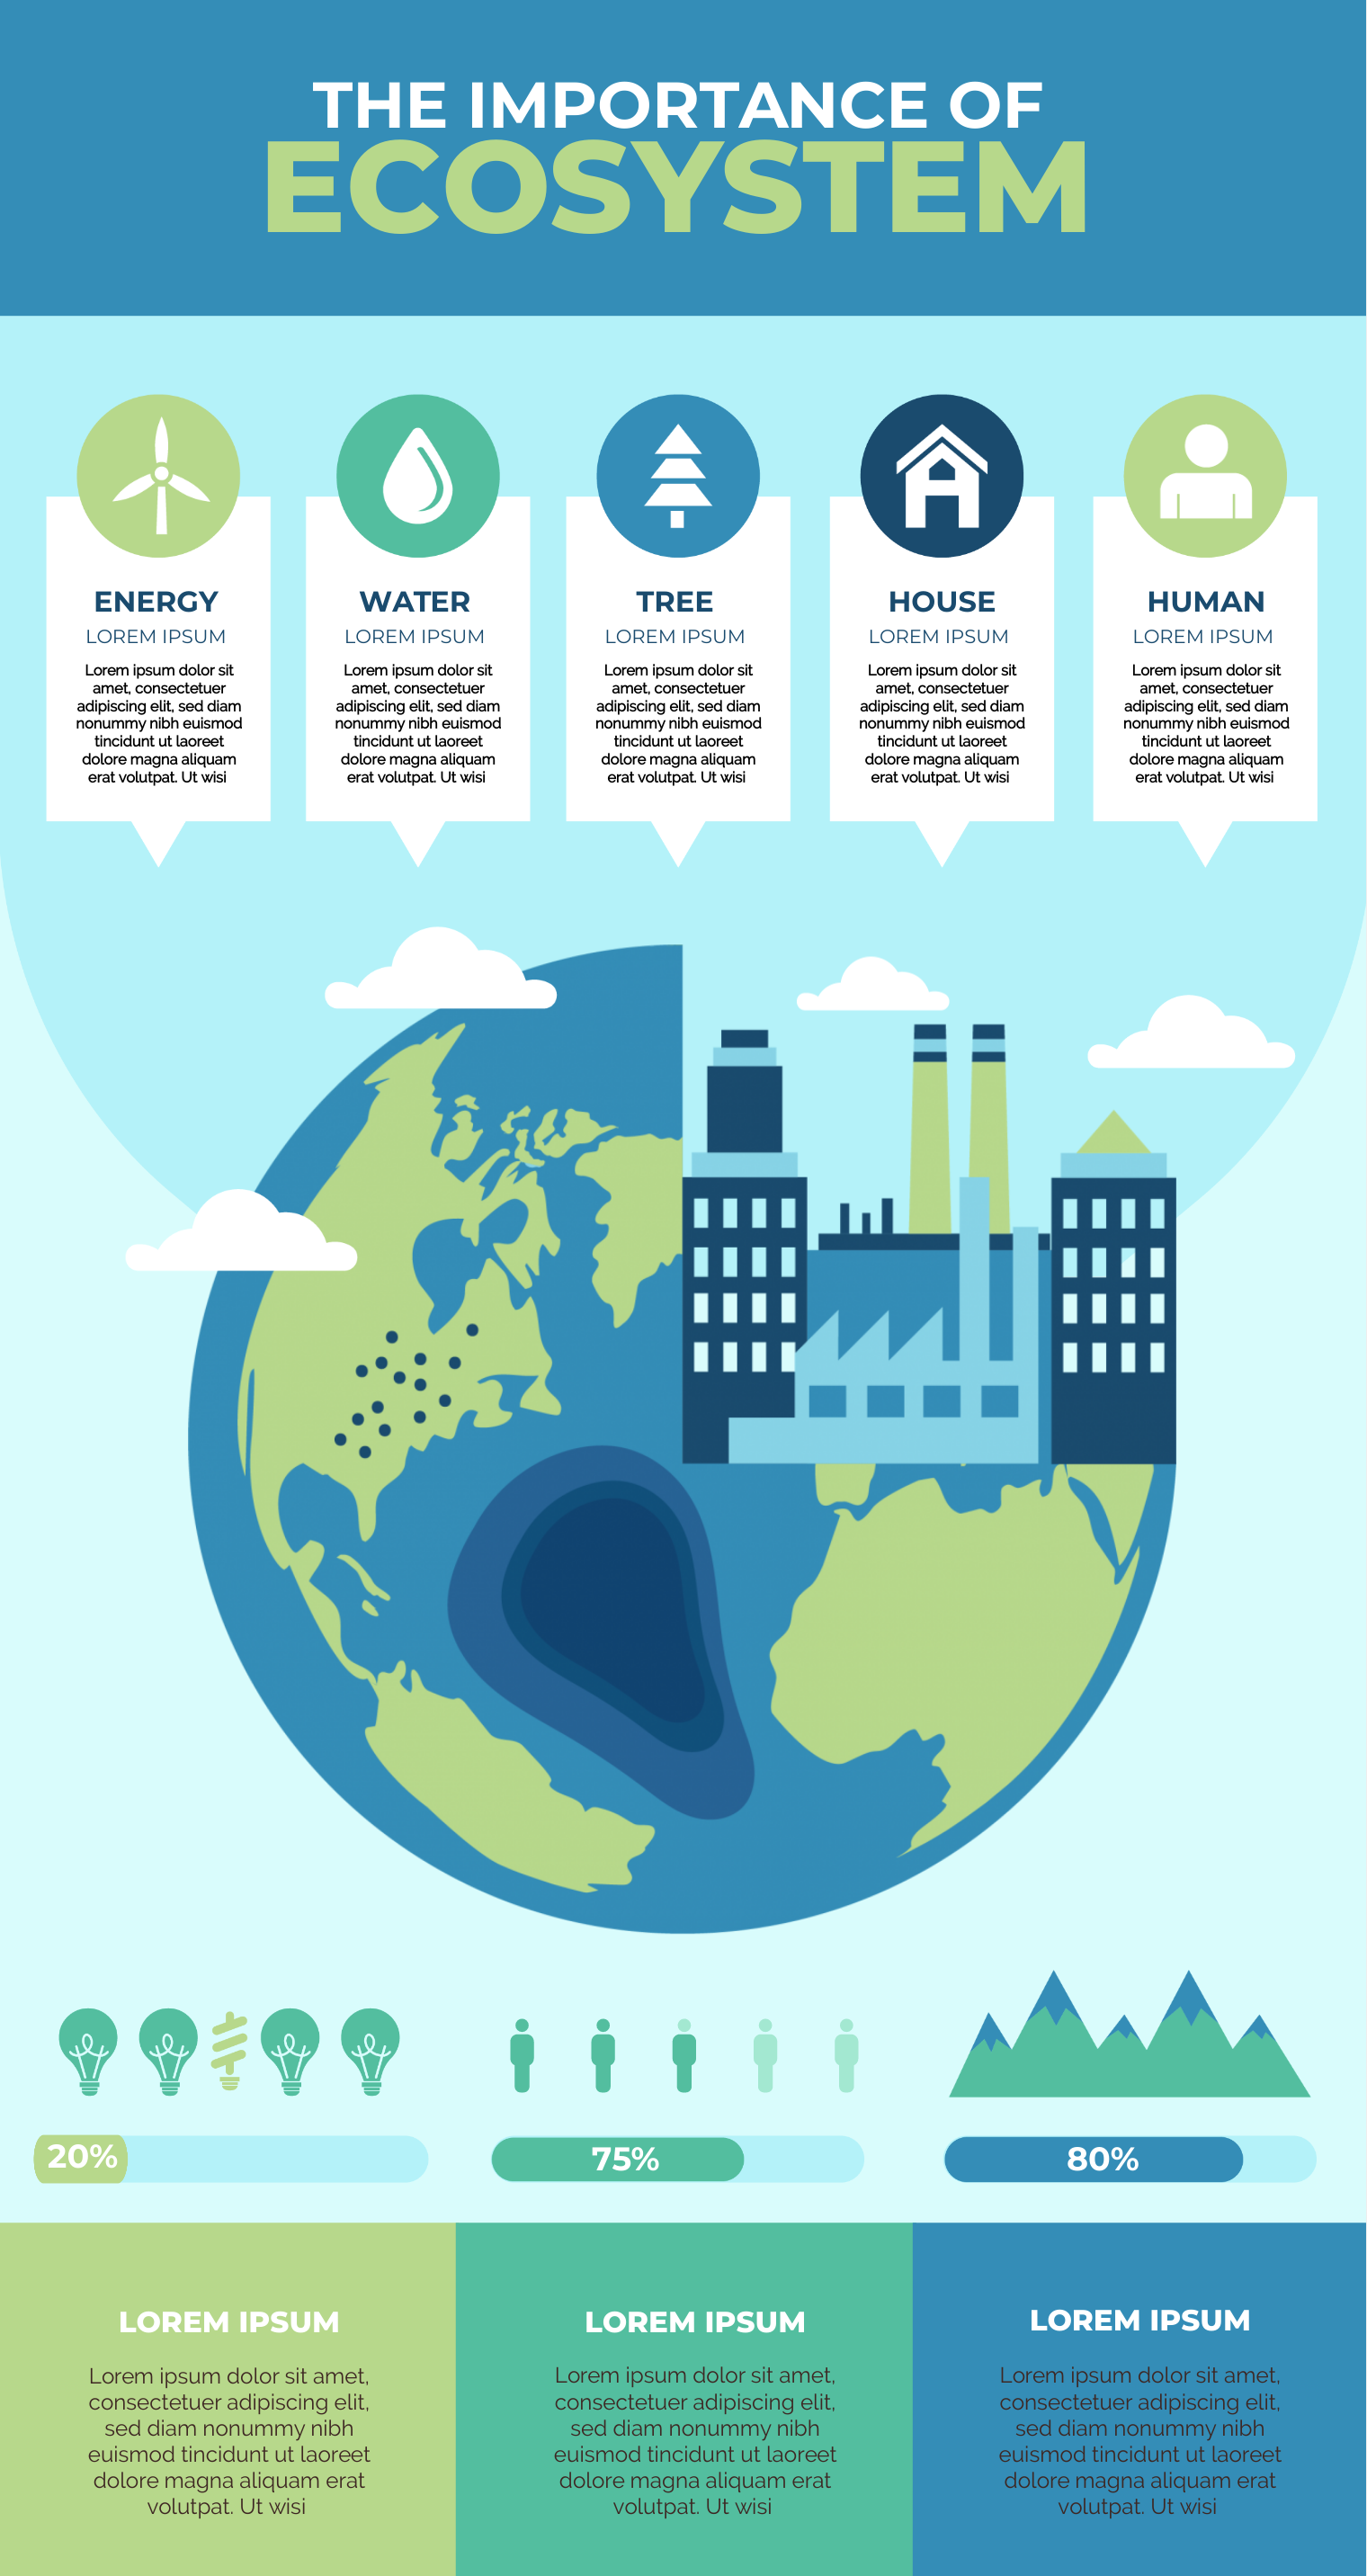
A4: Topics that involve processes, relationships, or large amounts of data, such as ecological systems, chemical reactions, and anatomical structures, tend to benefit significantly from the use of infographics.
Designing Infographics for Supporting Interactive Learning in Science Education
The target audience for designing infographics includes educators, students, and educational institutions aiming to improve learning outcomes in science. Drawing from personal experience, I found that implementing infographics during a biology unit on the human body greatly engaged my students. Using a detailed infographic to illustrate the cardiovascular system not only captivated their attention but also encouraged them to participate in discussions, asking questions about the flow of blood and the importance of each component. The students were able to visually connect concepts, which enhanced their understanding and retention significantly. From my experience, this approach transformed a traditionally challenging topic into an interactive learning experience, demonstrating the potential of infographics in driving education forward. 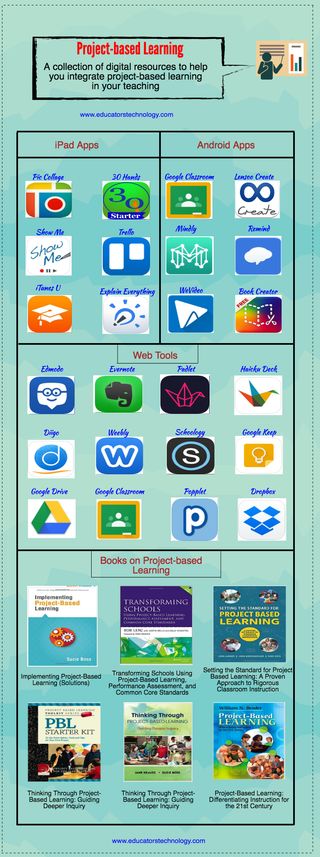

Insights into Effective Learning Strategies
Utilizing well-crafted infographics in science education allows for diverse learning strategies. Infographics cater to visual learners while providing a touchpoint for auditory and kinesthetic learners to engage with the material. The ability to adapt these visuals for various age groups and complexities makes them versatile teaching tools, greatly enhancing the learning experience for everyone involved.
If you are searching about 250 Infographics ideas in 2022 | education, infographic, educational you’ve visit to the right page. We have 10 Pics about 250 Infographics ideas in 2022 | education, infographic, educational like Infographics – Integrating Technology in the School Library Media Center, Science Education Center Infographics | Google Slides & PPT and also Educational infographic : Infographic Classroom Technologies. Here you go:
250 Infographics Ideas In 2022 | Education, Infographic, Educational
www.pinterest.com
physics science
Educational Infographic : Educational Infographic : Educational
infographicnow.com
educational infographic infographicnow
Infographic Resources – OnePointe Solutions
www.onepointesolutions.com
infographic onepointesolutions
Science Education Center Infographics PowerPoint Templates Free Download
www.homeppt.com
Educational Infographic : Infographic Classroom Technologies
infographicnow.com
Pin By Lindsay On School | SLP In 2020 | Educational Technology
www.pinterest.com
infographic student educational teaching infographics k12 nea besøk
Is Your Classroom Brain-friendly? See What Science Says. | Classroom
www.pinterest.ca
Science Education Center Infographics | Google Slides & PPT
slidesgo.com
Educational Infographic : A Great Infographic On Project-based Learning
infographicnow.com
Infographics – Integrating Technology In The School Library Media Center
techylibrary.weebly.com
Pin by lindsay on school. Is your classroom brain-friendly? see what science says.. Science education center infographics