Creating stunning and informative infographics can transform the way we communicate science to the public, making complex ideas accessible and engaging. Have you ever felt overwhelmed by dense scientific data? Infographics bridge this gap and invite curiosity, encouraging a deeper understanding of scientific concepts.
Enhancing Communication Through Infographics
Designing infographics for effective science communication serves as an essential tool for conveying information clearly and visually. Infographics allow researchers to present their findings in a manner that captures attention, simplifies complex data, and fosters engagement among diverse audiences. By integrating visuals with concise text, designers can efficiently highlight key points that might be overlooked in traditional formats.
Impact on Audience Engagement
The relevance of visual storytelling in science communication cannot be understated. Infographics enhance retention and understanding by catering to various learning styles, ensuring that the material resonates with a broader audience. When audiences are presented with visually appealing content, they are more likely to share it, amplifying its reach and facilitating informative discussions around scientific topics.
Optimal Timing and Platforms for Infographics
Advantages of Visual Communication
Utilizing infographics in science communication can lead to streamlined messaging and higher comprehension rates for viewers. By distilling vast amounts of information into digestible visuals, communicators can elevate audience understanding and spark interest in the subject matter. This not only benefits the dissemination of knowledge but also encourages further exploration and inquiry in scientific fields.
Frequently Asked Questions
1. What types of information are best suited for infographics?
Infographics are ideal for summarizing statistics, explaining processes, or presenting comparisons. They work well for conveying information that benefits from a visual representation.
2. How can I ensure my infographic is effective?
To create an effective infographic, focus on clear and concise messaging, cohesive design elements, and a logical flow of information that guides the viewer through the content.
3. Are there specific tools for designing infographics?
Yes, there are numerous tools available such as Canva, Piktochart, and Adobe Spark that provide user-friendly platforms for designing visually appealing infographics.
4. Can infographics be used in academic settings?
Absolutely! Infographics can serve as educational resources for students and educators, making complex topics more relatable and easier to understand in academic environments.
Designing Infographics for Effective Science Communication
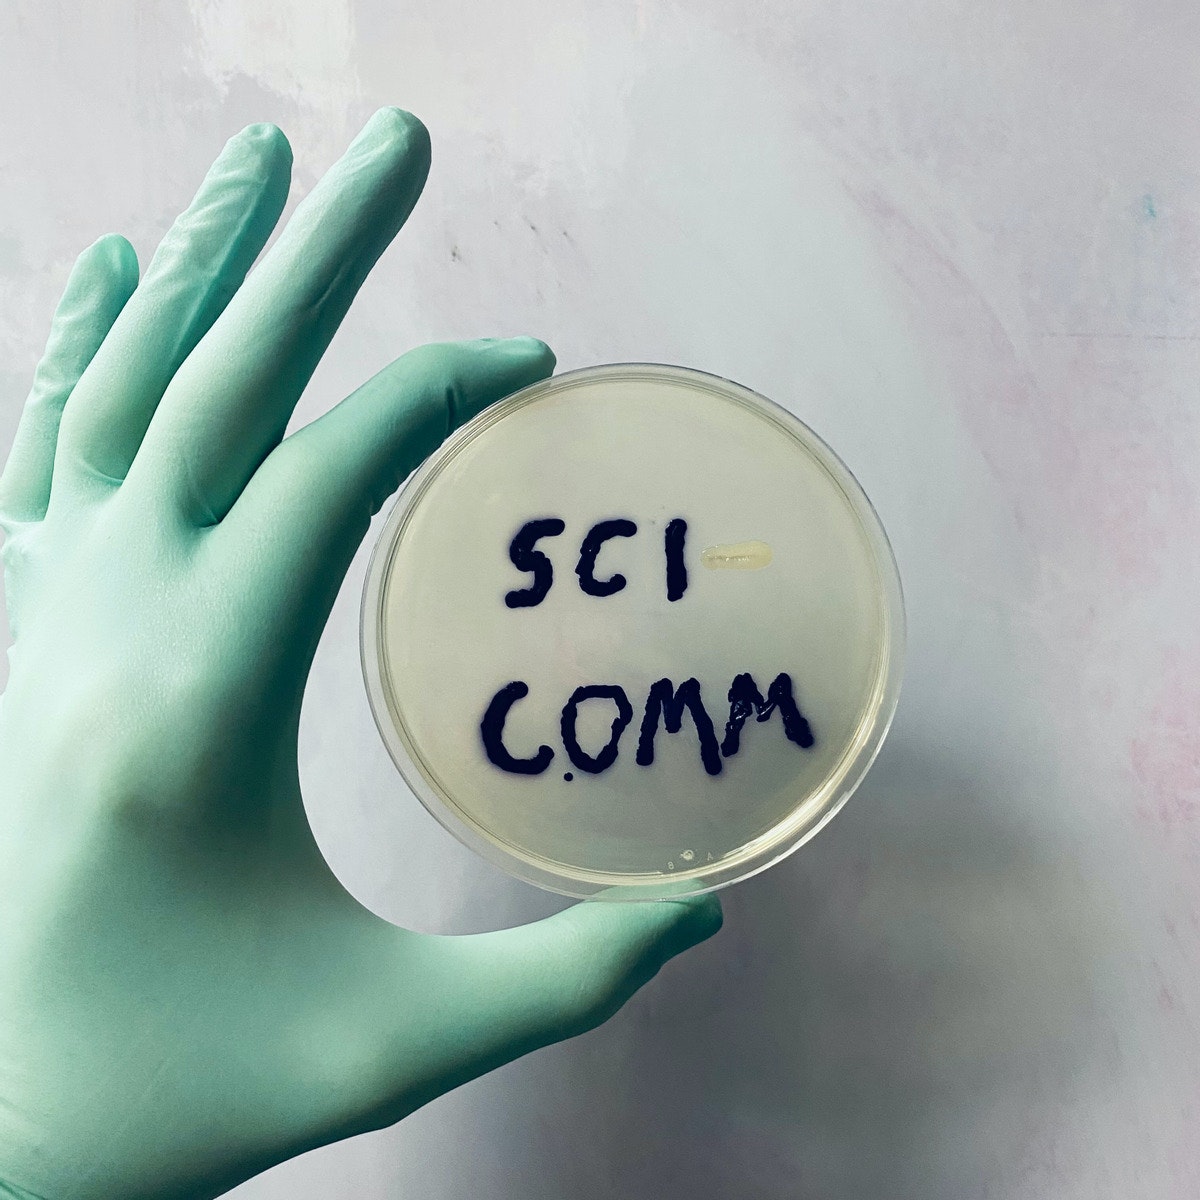
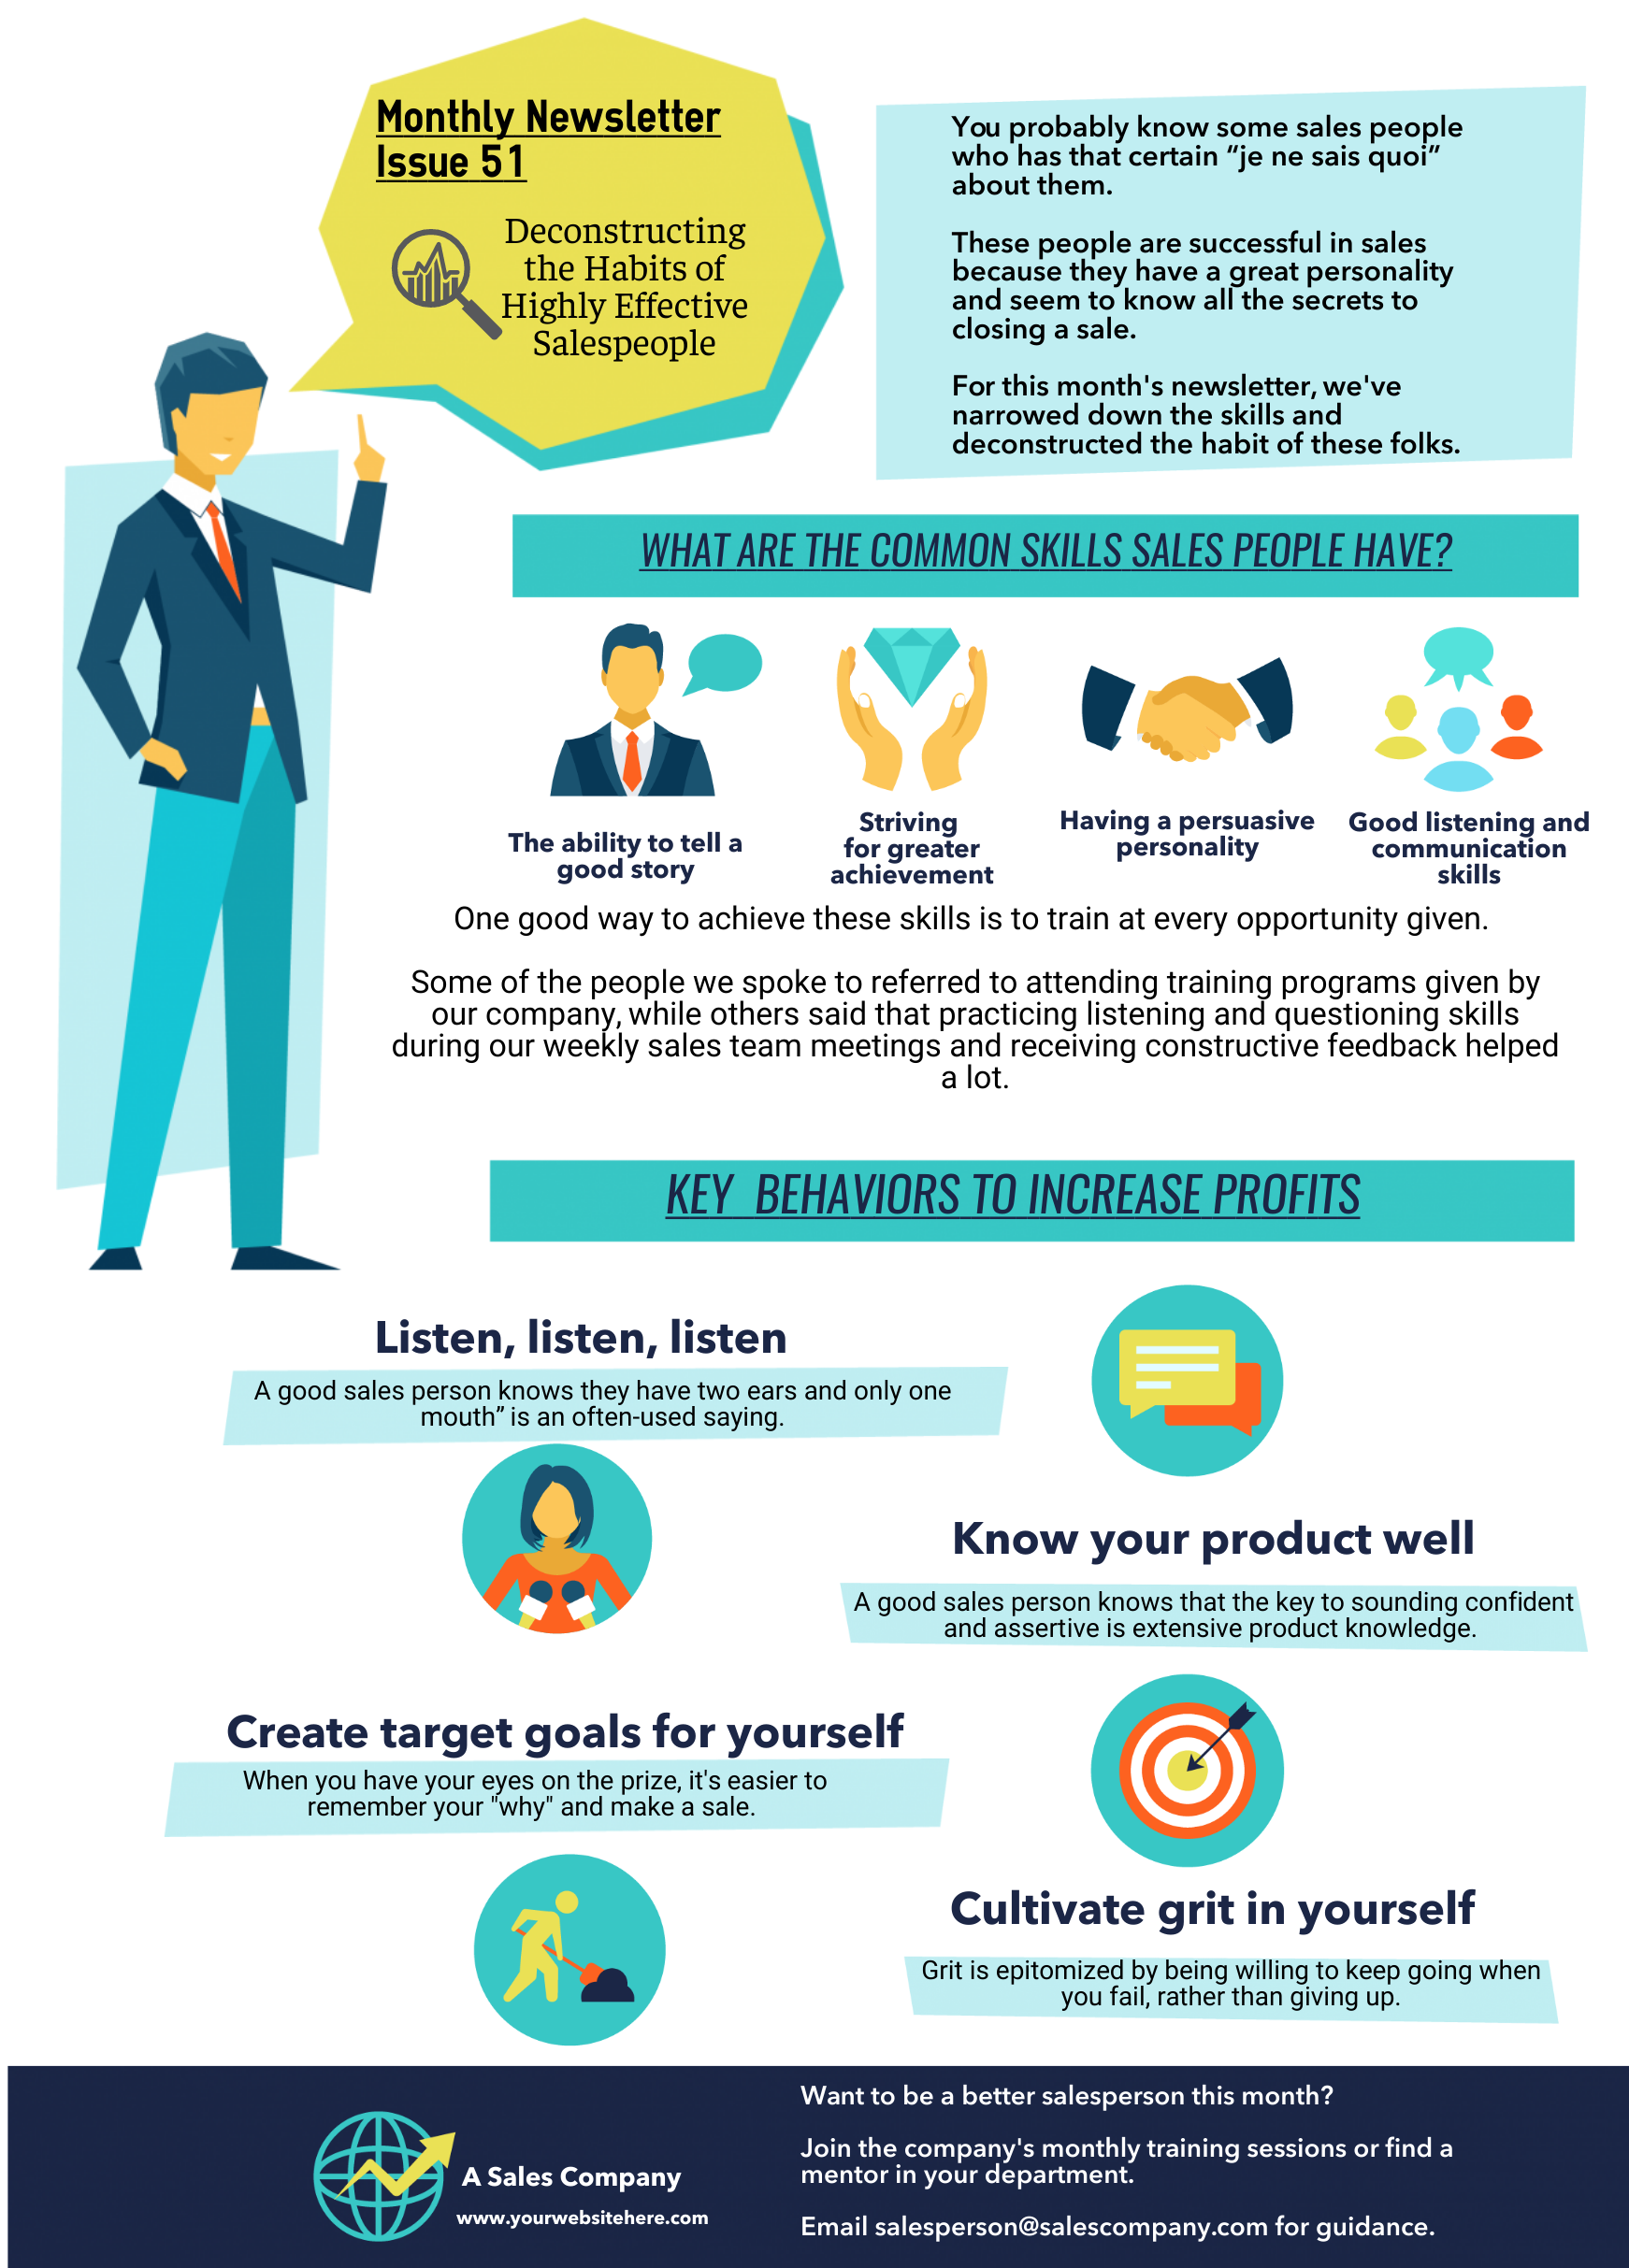
The target audience for infographics in science communication includes students, researchers, educators, and the general public. My personal experience with creating infographics for a research project revealed their incredible potential in conveying intricate scientific methodologies. I designed an infographic that illustrated the steps in a complex research process, integrating visuals and concise data points. The response was overwhelmingly positive, as students reported greater clarity and interest in the topic, demonstrating the power of infographics in educational outreach. By utilizing captivating images, like  and
and  , I was able to enhance the accessibility of the material and stimulate engaging discussions.
Final Thoughts on Designing Infographics for Effective Science Communication
Crafting infographics for science communication reveals a myriad of opportunities to connect with audiences on a visual level. The careful integration of design and messaging not only informs but also inspires. Through the thoughtful application of infographics, we can shape a more scientifically literate society, ensuring that vital information is both accessible and engaging.
If you are looking for Infographics – American Chemical Society you’ve came to the right web. We have 10 Pictures about Infographics – American Chemical Society like Effective Communication Presentation | Free Infographic Template, Infographics – American Chemical Society and also Cool Infographics: Effective Communication with Data Visualization and. Here you go:
Infographics – American Chemical Society
www.acs.org
infographics adderall acs
Effective Communication Presentation | Free Infographic Template
piktochart.com
About Us – The StratSciComm Project
strategicsciencecommunication.com
Cool Infographics: Effective Communication With Data Visualization And
www.pinterest.com
infographics cool data visualization communication books effective infographic pdf amazon information ebook science computer randy krum skip prichard graphic research
Science Infographic Design Stock Illustration – Download Image Now
www.istockphoto.com
Effective Science Communication Through Presentations, Posters, And
www.youtube.com
science communication effective
Designing Effective Science Communication | Datafloq
datafloq.com
Effective Science Communication (Second Edition): A Practical Guide To
www.amazon.com
Why Good Communication Is Great For Business Infographic – E-Learning
www.pinterest.es
Example Of Internal Communications Infographic Newsletter (1) – Simple
www.easel.ly
internal updating workforce ly easel
Designing effective science communication. Science infographic design stock illustration. Science communication effective


