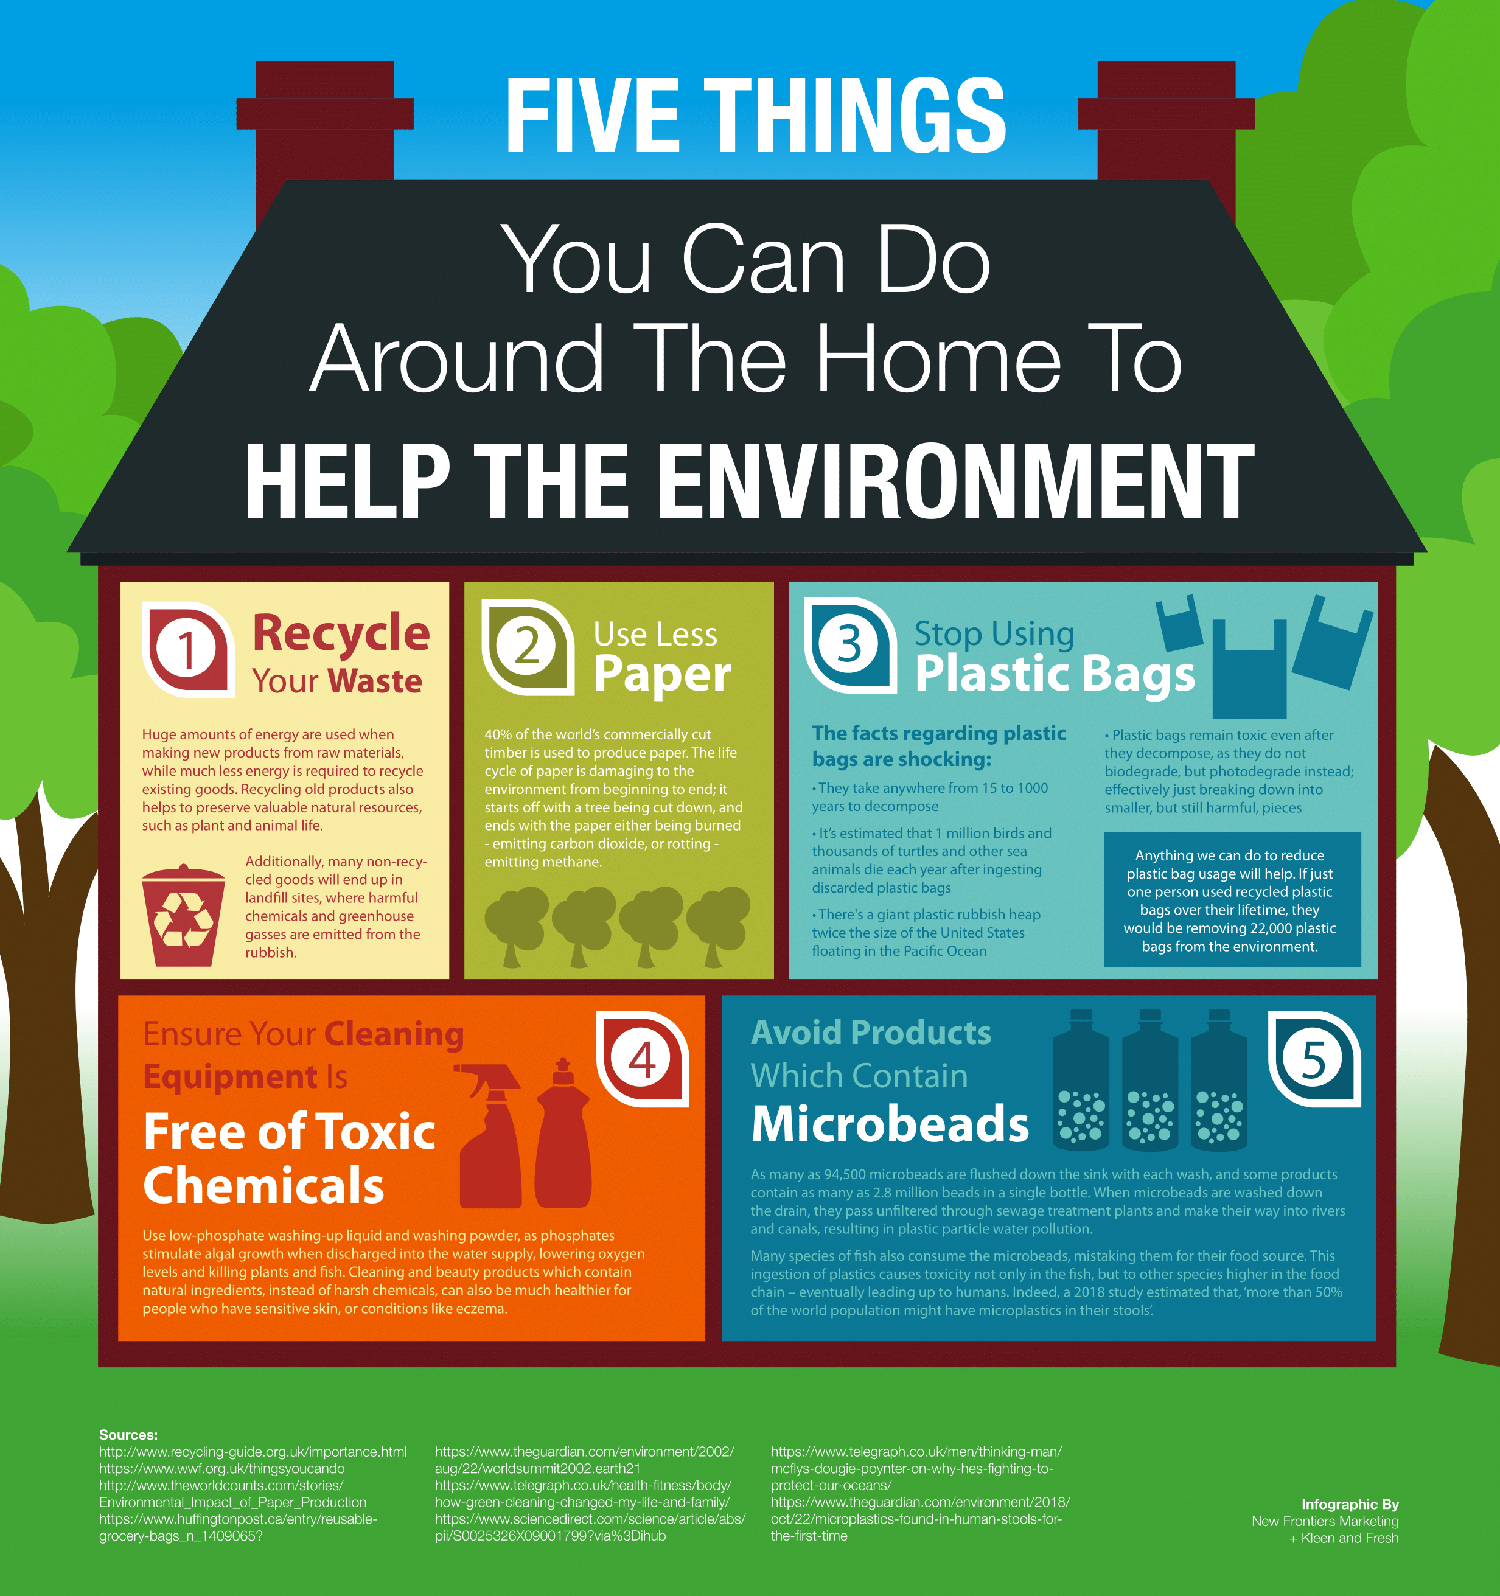
In today’s fast-paced educational environment, effective communication of policies and data is paramount. Infographics serve as powerful tools to distill complex information into digestible visuals, enabling educators, students, and policymakers to grasp essential concepts quickly. As we navigate the often intricate world of educational policy, understanding how to design impactful infographics becomes vital for fostering awareness and engagement.
Understanding the Need for Infographics
Creating infographics that elucidate educational policies enhances clarity and ensures that critical information reaches the intended audience. By utilizing visuals, one can break down extensive data and reformulate it into engaging, easy-to-understand format that appeals to diverse learning styles. This is especially beneficial in educational settings where students and teachers may struggle with traditional text-heavy materials.
Significance of Visual Communication
Visual communication transcends language barriers, making infographics valuable tools in educational discourse. They present complex statistics and concepts in a way that can be quickly absorbed, promoting better retention and understanding. By integrating graphical elements such as charts and icons, important messages can be delivered more effectively than through text alone, fostering an inclusive learning environment.
Optimal Timing and Context for Infographic Design
Strategically designing infographics during periods such as policy reviews, curriculum updates, or community outreach events aligns the visuals with relevant educational discussions. Involving key stakeholders during the design process can lead to more insightful visual narratives that resonate with the audience’s needs. Utilizing infographics during public presentations or online platforms also allows for wider dissemination of important information.
Gaining Advantage Through Infographic Utilization
Leveraging infographics can significantly enhance stakeholder engagement, leading to more informed discussions and decision-making. By making data accessible and visually appealing, schools can promote transparency and encourage participation from parents, educators, and community members. Infographics can ultimately drive a culture of collaboration and shared understanding within the educational sector.
Frequently Asked Questions
1. How can infographics aid in understanding educational policies?
Infographics simplify complex information, allowing stakeholders to grasp educational policies quickly and efficiently.
2. What tools can I use to create infographics for educational purposes?
There are various online tools such as Canva and Easel.ly that offer user-friendly templates for designing infographics.
3. Can infographics be effectively used in both print and digital formats?
Absolutely! Infographics can be adapted for both print and digital media, ensuring they reach a broader audience.
4. How do I ensure my infographics are engaging and informative?
Focus on clarity, aesthetics, and data accuracy. Use a compelling layout that highlights key points while maintaining visual appeal.
Designing Infographics for Educational Policy Understanding
The target audience for infographics in educational policy includes educators, administrators, students, and parents. My personal experience with designing infographics for presenting educational policies involved a community workshop aimed at enhancing parental involvement in schools. By transforming complex policy information into visual stories, I observed heightened engagement from parents who typically found the subject overwhelming. Incorporating visuals such as pie charts and timelines allowed attendees to see the direct implications of policies on their children’s education. 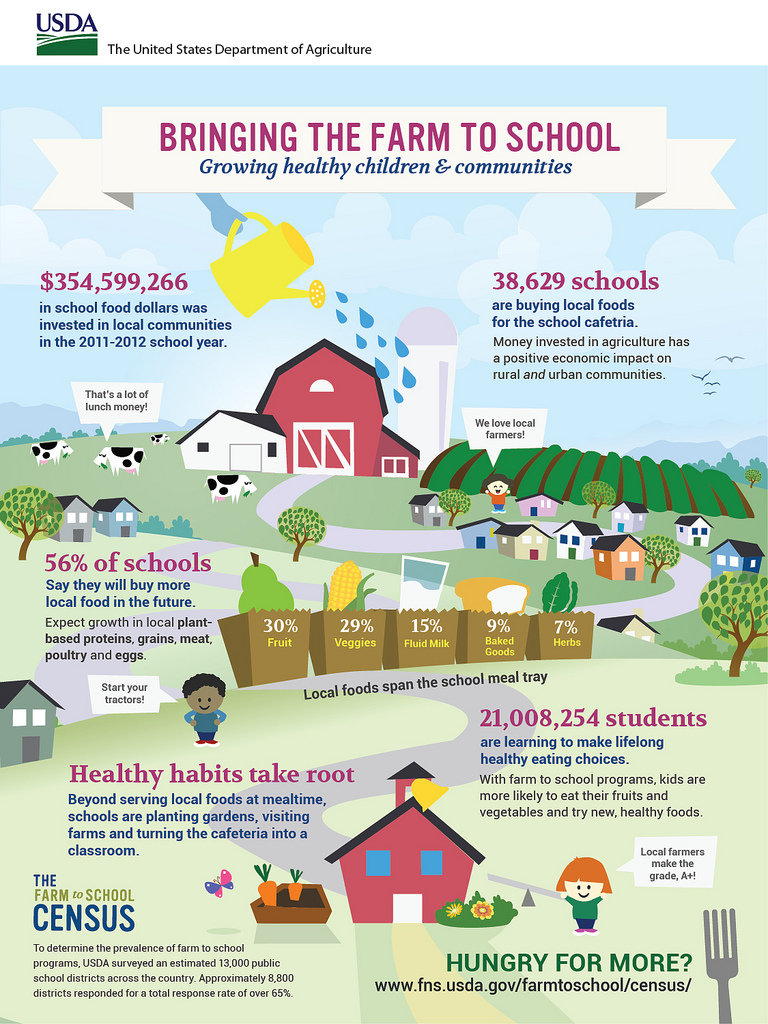
This experience reinforced the effectiveness of infographics in bridging gaps in understanding and fostering meaningful discussions among all stakeholders in the educational landscape.
Wrap Up on Designing Infographics for Educational Policy Understanding
As educational landscapes continuously evolve, the importance of effectively communicating policies cannot be underestimated. Designing infographics tailored for educational policy understanding not only enhances comprehension but also cultivates a collaborative atmosphere where everyone involved feels informed and empowered. Embracing the visual communication approach can transform the way stakeholders engage with educational content.
If you are looking for Infographic Maker For Kids you’ve visit to the right page. We have 10 Pictures about Infographic Maker For Kids like Designing for Diversity: Best Practices + Simple Tips – Venngage, 4 Effective Uses of Infographics in the Elementary Classroom | Sweet and also 4 Effective Uses of Infographics in the Elementary Classroom | Sweet. Here it is:
Infographic Maker For Kids
ar.inspiredpencil.com
Poster Education Design – Tulisan

blog.bintangasik.com
Designing For Diversity: Best Practices + Simple Tips – Venngage

venngage.com
diversity inclusion practices infographic infographics practice successful implementation venngage integration role
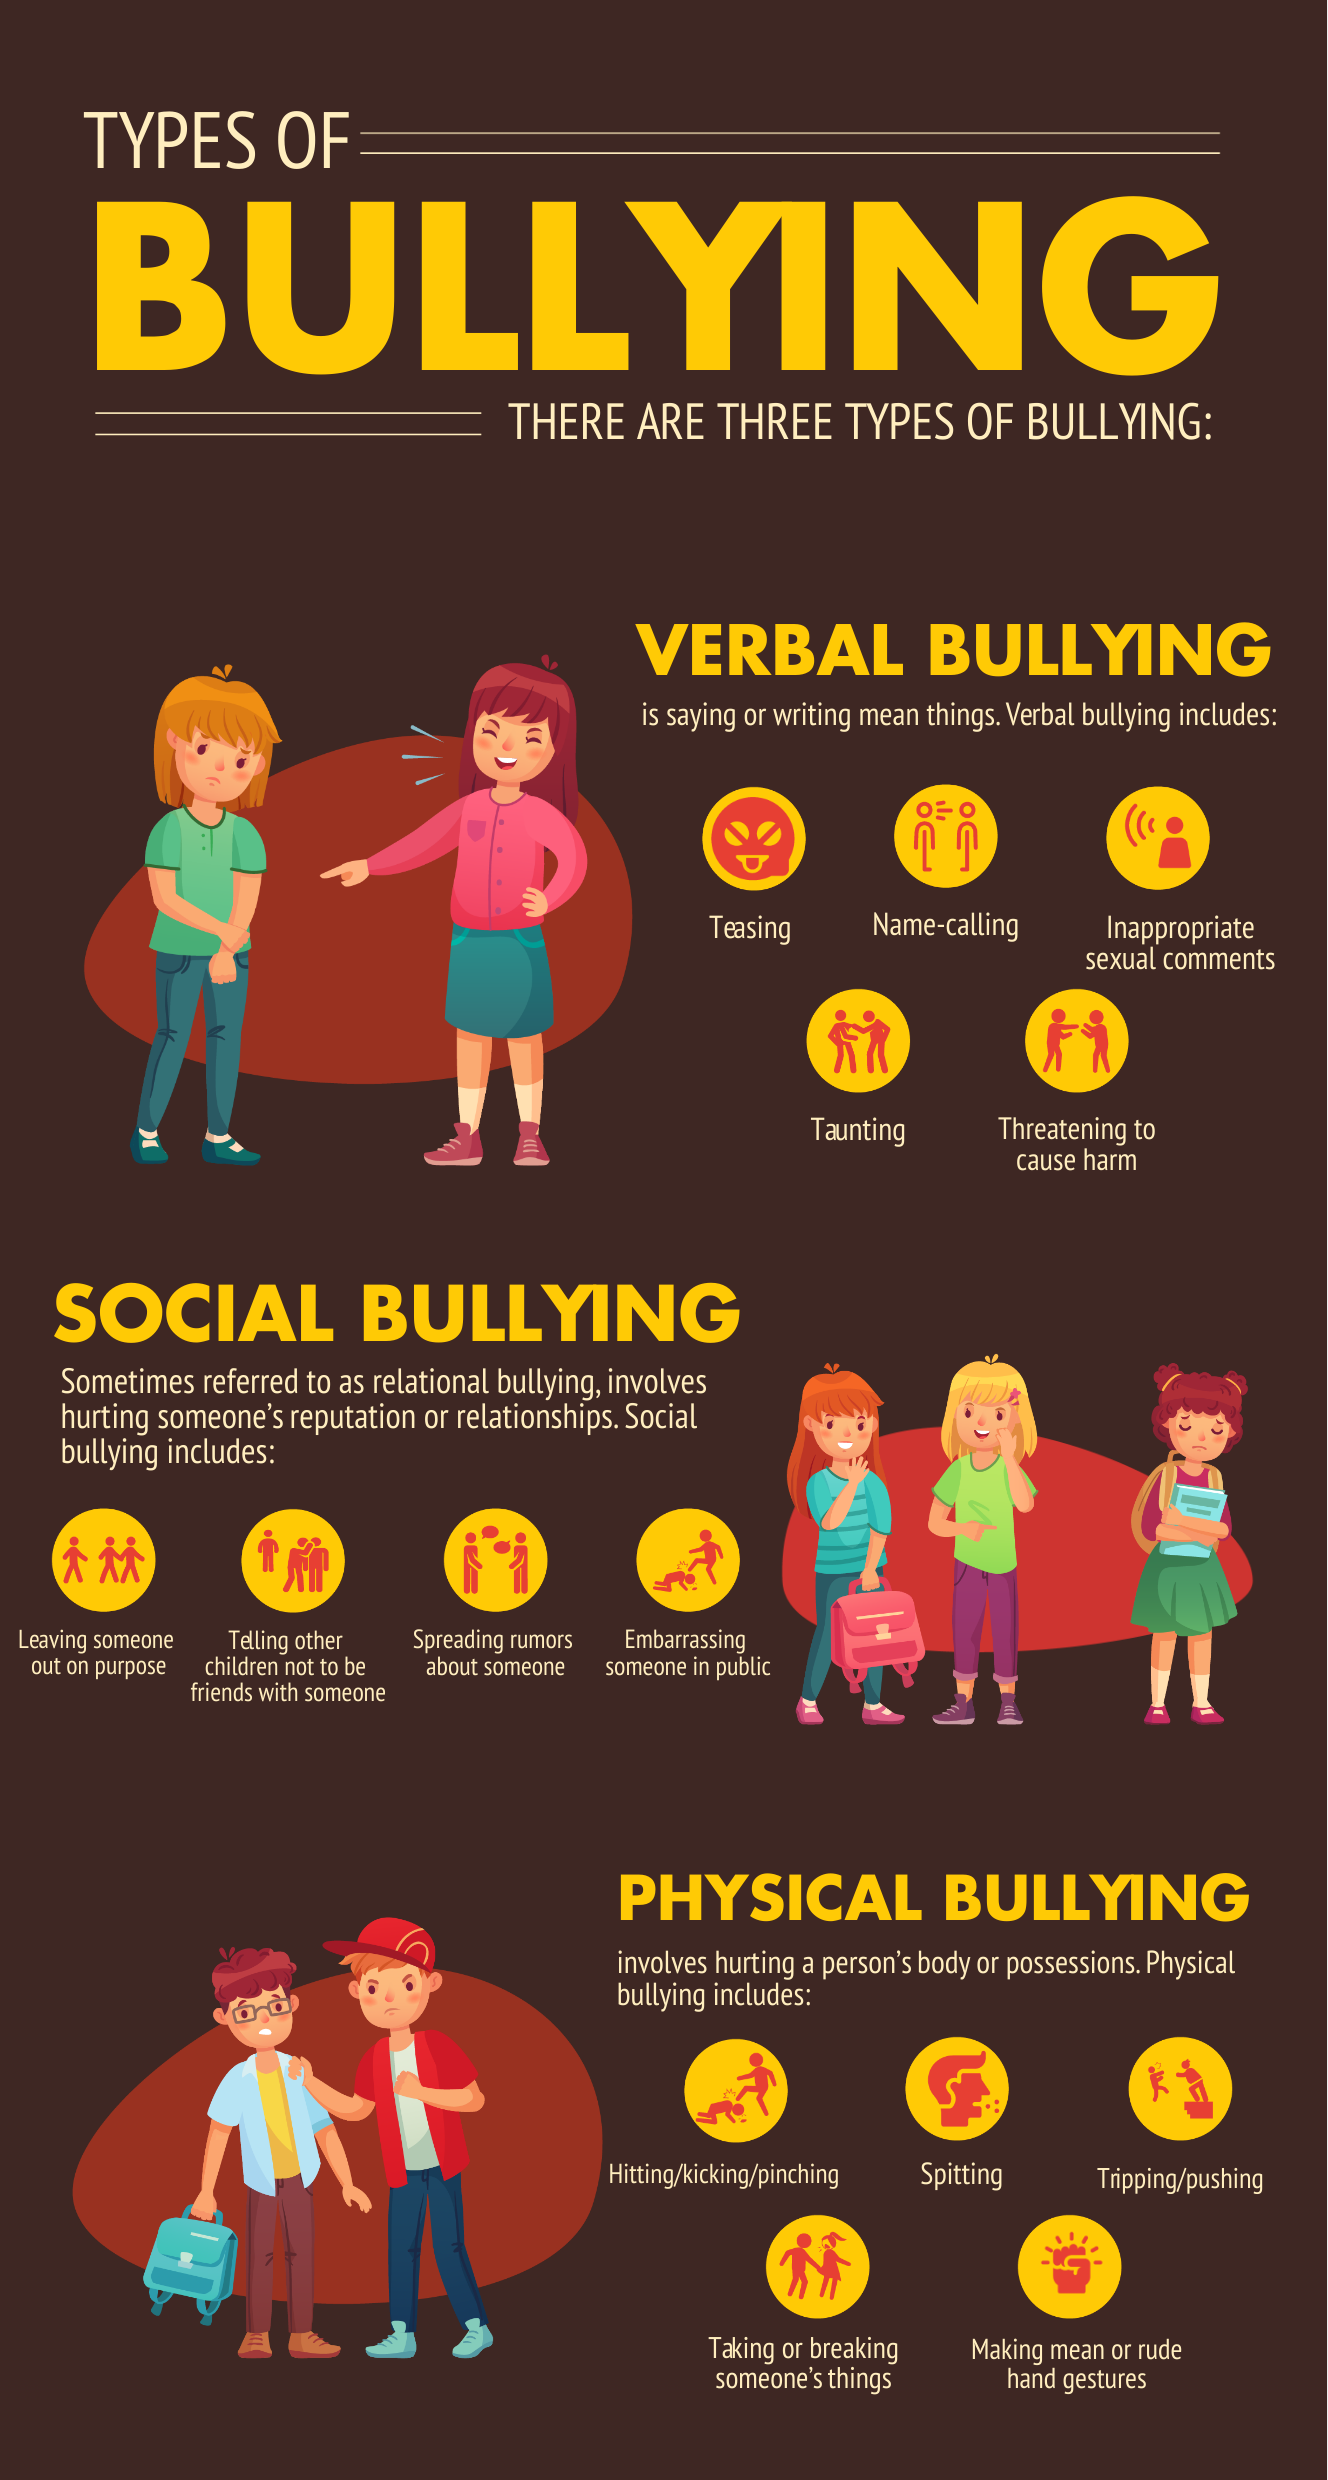
10 Great Examples Of Using Infographics For Education – Easelly
www.easel.ly
infographic bullying examples infographics types template education using customize
Infographic Tutorial Illustrator Logo Techniques

www.animalia-life.club
4 Effective Uses Of Infographics In The Elementary Classroom | Sweet

www.sandycangelosi.com
school farm infographic infographics usda students kids elementary bringing census children classroom activities information literacy visual local healthy national schools
The Learning Zones Of A Classroom Infographic Education Infographics
www.aiophotoz.com
Bildung Infografik-vorlage | Kostenlose Vektor

de.freepik.com
bildung infografik vorlage vektoren
14 Great Infographic Examples For Education You Should Definitely Check

graphicmama.com
infographic social teachers education technology educational infographics teacher teaching examples learning language twitter arts web school tools edtech scholastic posters
USDA Farm To School Census Infographic | "Bringing The Farm … | Flickr

www.flickr.com
infographics usda census literacy kids analyzing schools usdagov initiatives food discovered farms jamonkey
4 effective uses of infographics in the elementary classroom. Designing for diversity: best practices + simple tips. Bildung infografik vorlage vektoren


