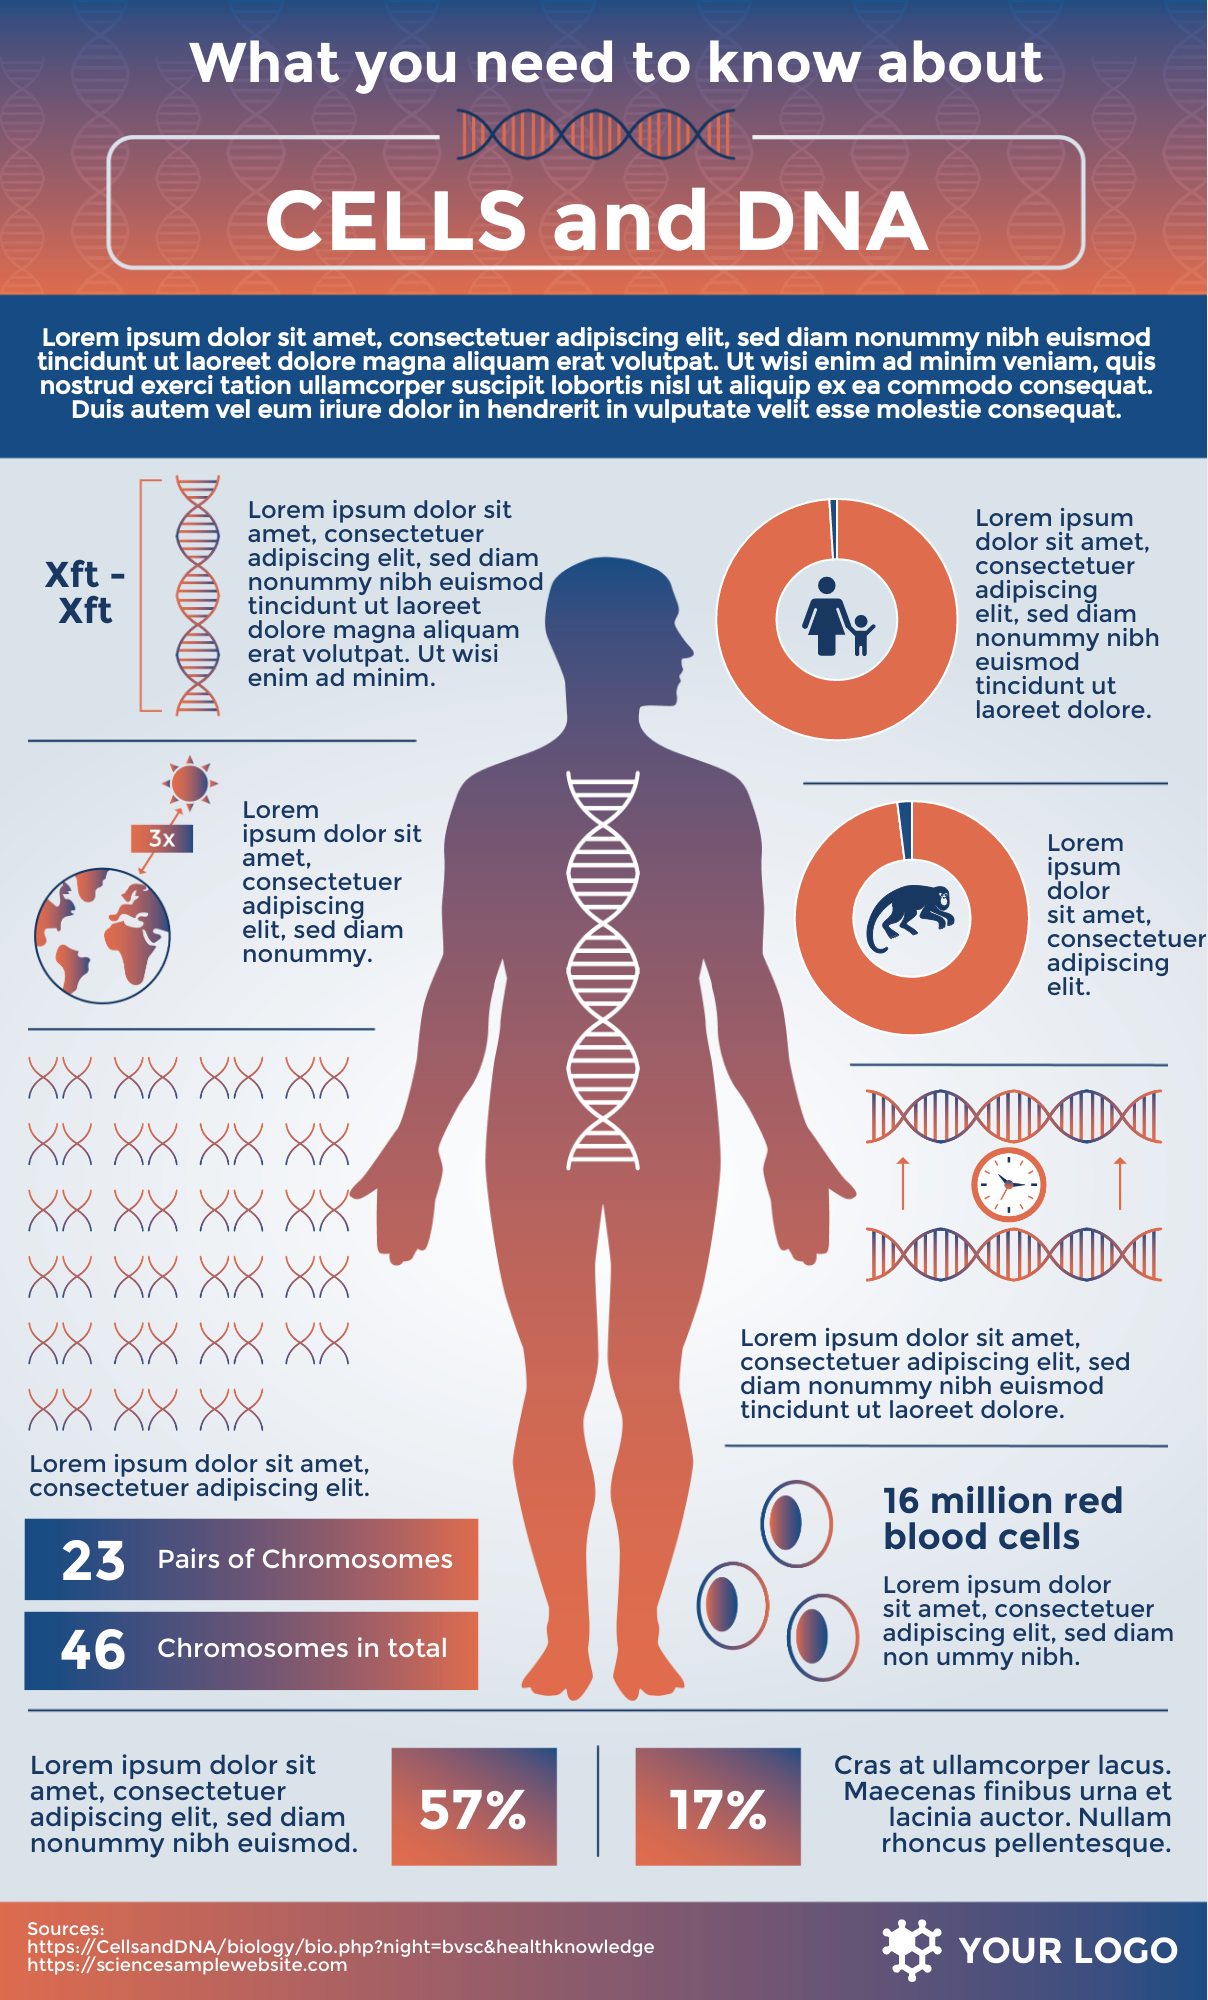
In today’s data-driven world, educational metrics play a crucial role in understanding the effectiveness of teaching strategies and student performance. One effective method to present this data is through engaging infographics that not only capture attention but also facilitate comprehension. By transforming complex data into visually appealing formats, you can unlock valuable insights for educators and stakeholders alike.
Exploring the Art of Infographics
Creating infographics for visualizing important educational metrics enables educators and administrators to distill large amounts of data into clear, digestible visual content. This approach allows for a quick understanding of trends and patterns that might otherwise go unnoticed in traditional spreadsheets or reports. Infographics can encapsulate critical assessments such as student achievements, retention rates, and resource allocations, which are essential for informed decision-making.
Significance of Visual Data Representation
The utilization of infographics significantly enhances the way educational metrics are communicated to various audiences. Visuals can transcend language barriers and cultural differences, ensuring that important information reaches everyone effectively. Moreover, infographics foster improved retention of information, as people are more likely to remember visuals compared to text-heavy materials. This makes them an essential tool for presentations, reports, and social media content aimed at stakeholders and the broader community.
Timing and Context for Effective Infographics
Advantages of Engaging Infographics
Crafting infographics tailored to educational metrics leads to numerous positive outcomes. These visuals can boost engagement in presentations, increase data accessibility for educators and stakeholders, and stimulate discussions that lead to collaborative solutions. The use of colors, icons, and charts can captivate audiences while simplifying the most complex information, turning data from a passive consumption into an interactive experience.
Frequently Asked Questions
What tools can I use to create infographics?
There are several user-friendly tools available, including Canva, Piktochart, and Infogram, which offer templates and design features tailored for creating educational infographics.
How do I ensure my infographic is effective?
Focus on clarity and simplicity. Use a cohesive color scheme, limit the amount of text, and incorporate relevant visuals that enhance comprehension without overwhelming the viewer.
Can infographics be used in all educational contexts?
Absolutely! Infographics can be adapted to various subjects and educational contexts, making them versatile for classrooms, administrative reports, and community presentations.
What key metrics should I include in my infographic?
It often depends on the audience and purpose. Common metrics may include student performance data, attendance rates, graduation rates, and demographic breakdowns.
Creating Infographics for Visualizing Important Educational Metrics
The target audience for these infographics includes educators, school administrators, parents, and policymakers. During a recent project, I combined various educational metrics into a visually appealing infographic that highlighted our school’s performance over the last academic year. By using vibrant colors and structured formats, the infographic effectively conveyed information on student successes and areas for improvement. Images, such as charts and icons, were integrated to transform raw data into an engaging narrative that captivated our audience during the school board meeting. This experience underscored the power of visual storytelling in education, as stakeholders were not only informed but also inspired to take action based on the presented metrics.


Insights on Crafting Infographics for Educational Metrics
By tailoring your infographics to highlight important educational metrics, you can enhance understanding and engagement among your target audience. Infographics serve as a bridge between data and decision-making, allowing educators to visualize their impact more effectively. Embrace the challenge of transforming metrics into captivating visuals to foster an environment of collaboration and innovation in education.
If you are searching about Infographic Templates & Designs – Venngage | Infographic templates, Bar you’ve came to the right place. We have 10 Images about Infographic Templates & Designs – Venngage | Infographic templates, Bar like 
Infographic Templates & Designs – Venngage | Infographic Templates, Bar
www.pinterest.com
infographic templates choose board
รายการ 92+ ภาพพื้นหลัง Infographic คอมพิวเตอร์ ครบถ้วน
littlestarcenter.edu.vn
Education & Learning Infographic | Education Illustrations ~ Creative
creativemarket.com
infographic
Infographic Template For Education
www.smartdraw.com
infographic education template example infographics examples educational edit click
 +5 Tipos De Infografía Y Cómo Usarlos + Ejemplos [2024]
www.crehana.com
Education Infographics Stock Vector. Illustration Of Diagrams – 265815027
www.dreamstime.com
Infographics In The Classroom
www.slideshare.net
Educational Infographic : – InfographicNow.com | Your Number One
infographicnow.com
Educational Infographic : Educational Infographic & Data Visualisation
infographicnow.com
infographic educational study data visualisation yule george educati language infographics linguistics infographicnow description cambridge languages
64 Important Business Metrics Your Company Must Know – NTask
www.ntaskmanager.com
metrics
Infographic template for education. Infographics in the classroom. Education infographics stock vector. illustration of diagrams


