In today’s visually-driven world, educators have the unique opportunity to captivate their students with compelling infographics that not only inform but also engage. Creating educational infographics that resonate with learners can elevate teaching methods and simplify complex topics. As you embark on this exciting journey, understanding the best practices for creating these infographics is essential to ensuring they are both effective and memorable.
Utilizing infographics in education opens doors to enhanced understanding and retention of information. It allows teachers to distill intricate concepts into digestible visual formats, enabling students to grasp essential ideas more clearly. Infographics serve as powerful tools that can cater to various learning styles, making lessons more effective and inclusive.
To craft infographics that truly make an impact, teachers must consider their audience’s needs and preferences. Well-designed visuals can bridge gaps in comprehension and provide clarity where traditional teaching methods may fall short. By focusing on creating visually appealing and informative content, educators can foster a more engaging learning environment and promote deeper understanding among students.
Timing plays a critical role in the creation and implementation of educational infographics. Using these resources at the outset of a new topic can set a strong foundation for learning, while referencing them during lessons can reinforce key points. Moreover, incorporating infographics into assessments or reviews can solidify knowledge retention and encourage interactive discussions.
Integrating best practices for creating educational infographics presents numerous advantages. By employing visuals that appeal to students, educators can spark interest, encourage participation, and facilitate better comprehension. Additionally, these tools help to break down information into manageable segments, leading to improved performance and outcomes in the classroom.
Frequently Asked Questions about Best Practices for Creating Educational Infographics for Teachers
Question 1: How can I determine the right information to include in an infographic?
Answer: Focus on core concepts that align with learning objectives and ensure the information is relevant and engaging for your audience.
Question 2: What tools are best for creating educational infographics?
Answer: There are a variety of user-friendly tools available, such as Canva, Piktochart, and Easel.ly, which cater to users with varying levels of design experience.
Question 3: Can infographics be used across different subjects?
Answer: Absolutely! Infographics can enhance learning in virtually any subject, from math and science to history and language arts.
Question 4: How do I assess the effectiveness of my infographics?
Answer: Gather feedback from students regarding their comprehension and engagement levels, and consider using assessments that incorporate your infographics.
Best Practices for Creating Educational Infographics for Teachers
The target of best practices for creating educational infographics is to guide educators in effectively communicating information through visual means. Throughout my teaching experience, I’ve found that implementing infographics significantly transformed how my students interacted with complex subjects. For instance, when I introduced a unit on climate change, the use of an infographic illustrating key data points allowed my students to visualize the information in a manner that aligned with their learning styles. The result was not only increased engagement but also higher retention rates, as they were able to connect the visual data with real-world implications. Here’s one of the infographics I created during this unit:

Visual aids such as infographics truly enhance classroom learning experiences and help simplify even the most challenging topics.
Conclusion of Best Practices for Creating Educational Infographics for Teachers
Effective utilization of infographics not only enriches the educational experience but also equips educators with the tools to present information in an engaging and accessible manner. By adhering to the best practices mentioned, teachers can enhance their teaching methods, foster better comprehension, and inspire a love for learning among their students. Embracing these strategies is a step toward becoming a more innovative and impactful educator.
If you are looking for The 6 Ways to Become a 21st Century Teacher (Infographic) you’ve visit to the right web. We have 10 Pictures about The 6 Ways to Become a 21st Century Teacher (Infographic) like How to Use Infographics for Language Learning, Infographic Sample and also 10 Best Practices to Design and Develop Exceptional Training Content. Here it is:
The 6 Ways To Become A 21st Century Teacher (Infographic)
www.learningsuccessblog.com
lehrer learningsuccessblog jahrhunderts nuiteq
The Profession Of Teaching Worldwide Infographic – E-Learning Infographics
elearninginfographics.com
infographic teaching profession infographics educational worldwide education learning world teacher teachers infographi around infographicnow
Infographics About Language Teaching Methods. | Download Scientific Diagram
www.researchgate.net
Teachers' Instructional Strategies Infographic – E-Learning Infographics
elearninginfographics.com
instructional strategies learning infographic teaching strategy instruction ideas teachers methods activities teacher classroom differentiated infographics differentiation education lesson coaching poster
Pin By Aureliobowesuyi On Education | Design Thinking Education, Design
www.pinterest.com
infographic educational elearninginfographics confession infographics obsessed influencing infographicnow instructional
Infographic Sample
mavink.com
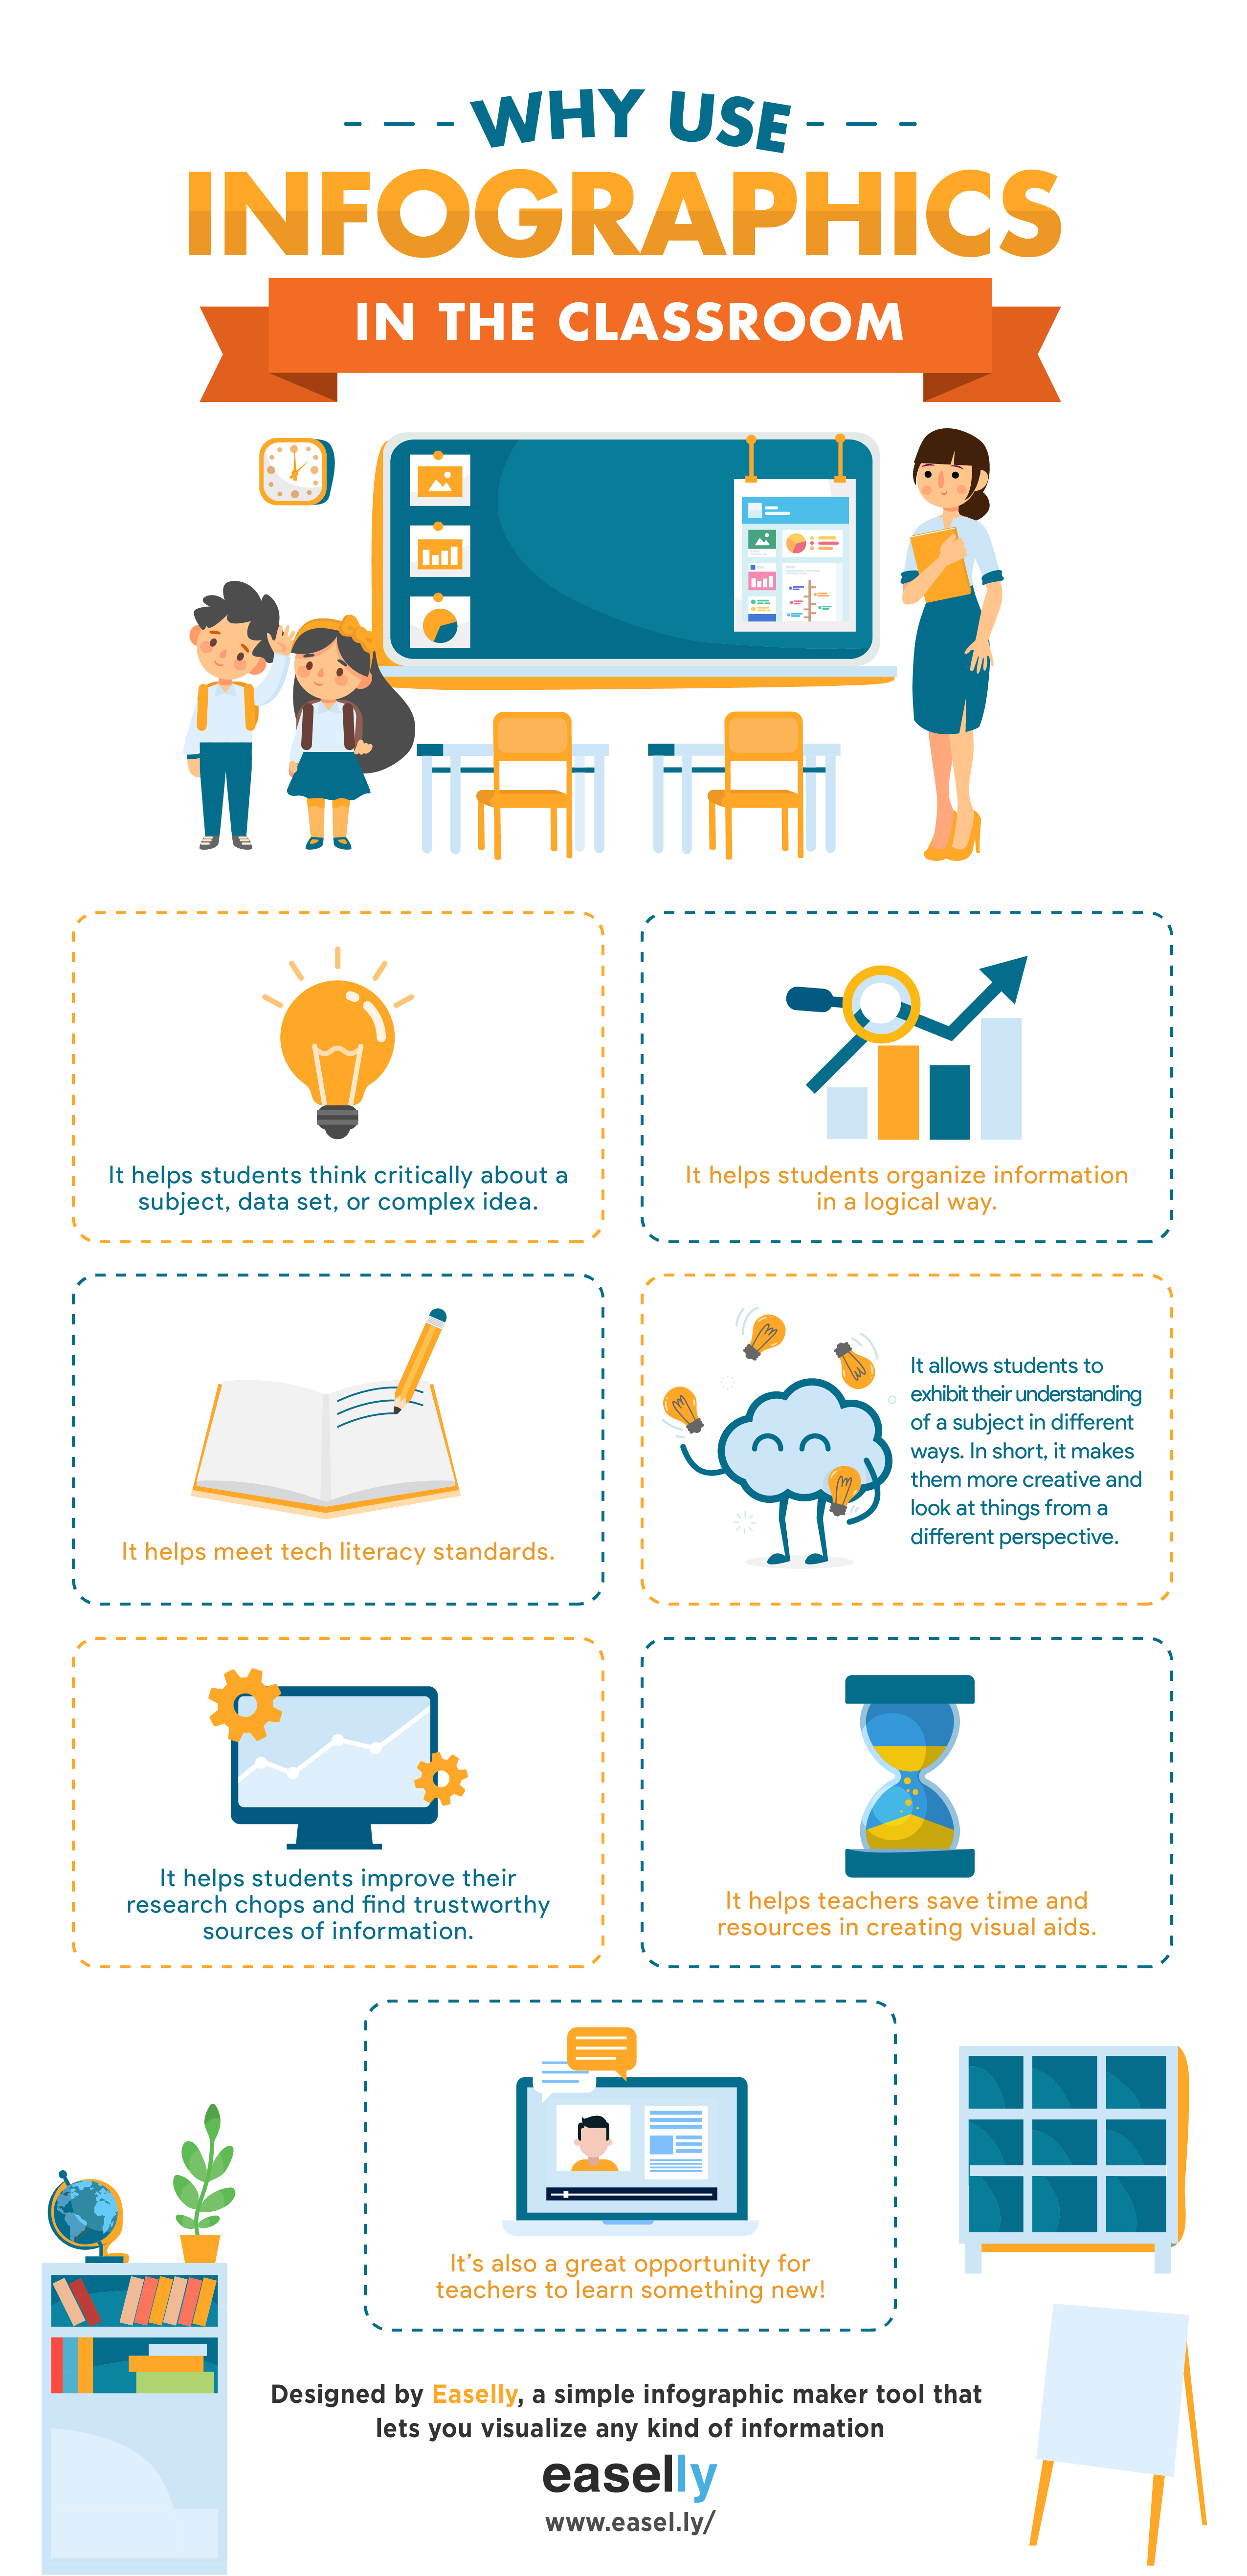
How To Use Infographics For Language Learning
www.easel.ly
language why effective easelly learners easel educators
Infographic Explaining Infographics
ar.inspiredpencil.com
10 Best Practices To Design And Develop Exceptional Training Content
www.pinterest.co.kr
Los Profesores No Trabajan Lo Suficiente – ImaXinante
imaxinante.com
trabajan busyteacher suficiente profesores unpaid expectation overtime colleges
How to use infographics for language learning. Pin by aureliobowesuyi on education. Infographic educational elearninginfographics confession infographics obsessed influencing infographicnow instructional


