Infographics have transformed the way we present information, especially in educational storytelling. By combining visuals, data, and narrative, you can captivate your audience’s attention and enhance comprehension. If you’re eager to learn how to create infographics that effectively communicate educational content, you’ve come to the right place!
Creating Infographics for Educational Storytelling
Crafting infographics allows educators to distill complex information into easily digestible formats. It not only aids in presenting data but also supports diverse learning styles, making lessons more accessible. Through visual representation, abstract concepts become tangible, sparking curiosity and engagement among learners.
Significance of Infographics in Education
The use of infographics has great influence in an educational context, serving as a bridge between knowledge and understanding. They help reinforce the material by creating a visual narrative that resonates with students. This engagement can lead to better retention and comprehension, enhancing the overall educational experience.
Optimal Timing and Placement for Infographics
Infographics find their greatest impact when integrated into teaching materials or presentations that coincide with relevant subject matter. The perfect moments for their usage include lectures, workshops, or even as supplementary study materials. When introduced at pivotal learning milestones, they can significantly enhance student outcomes.
Advantages of Infographics in Educational Contexts
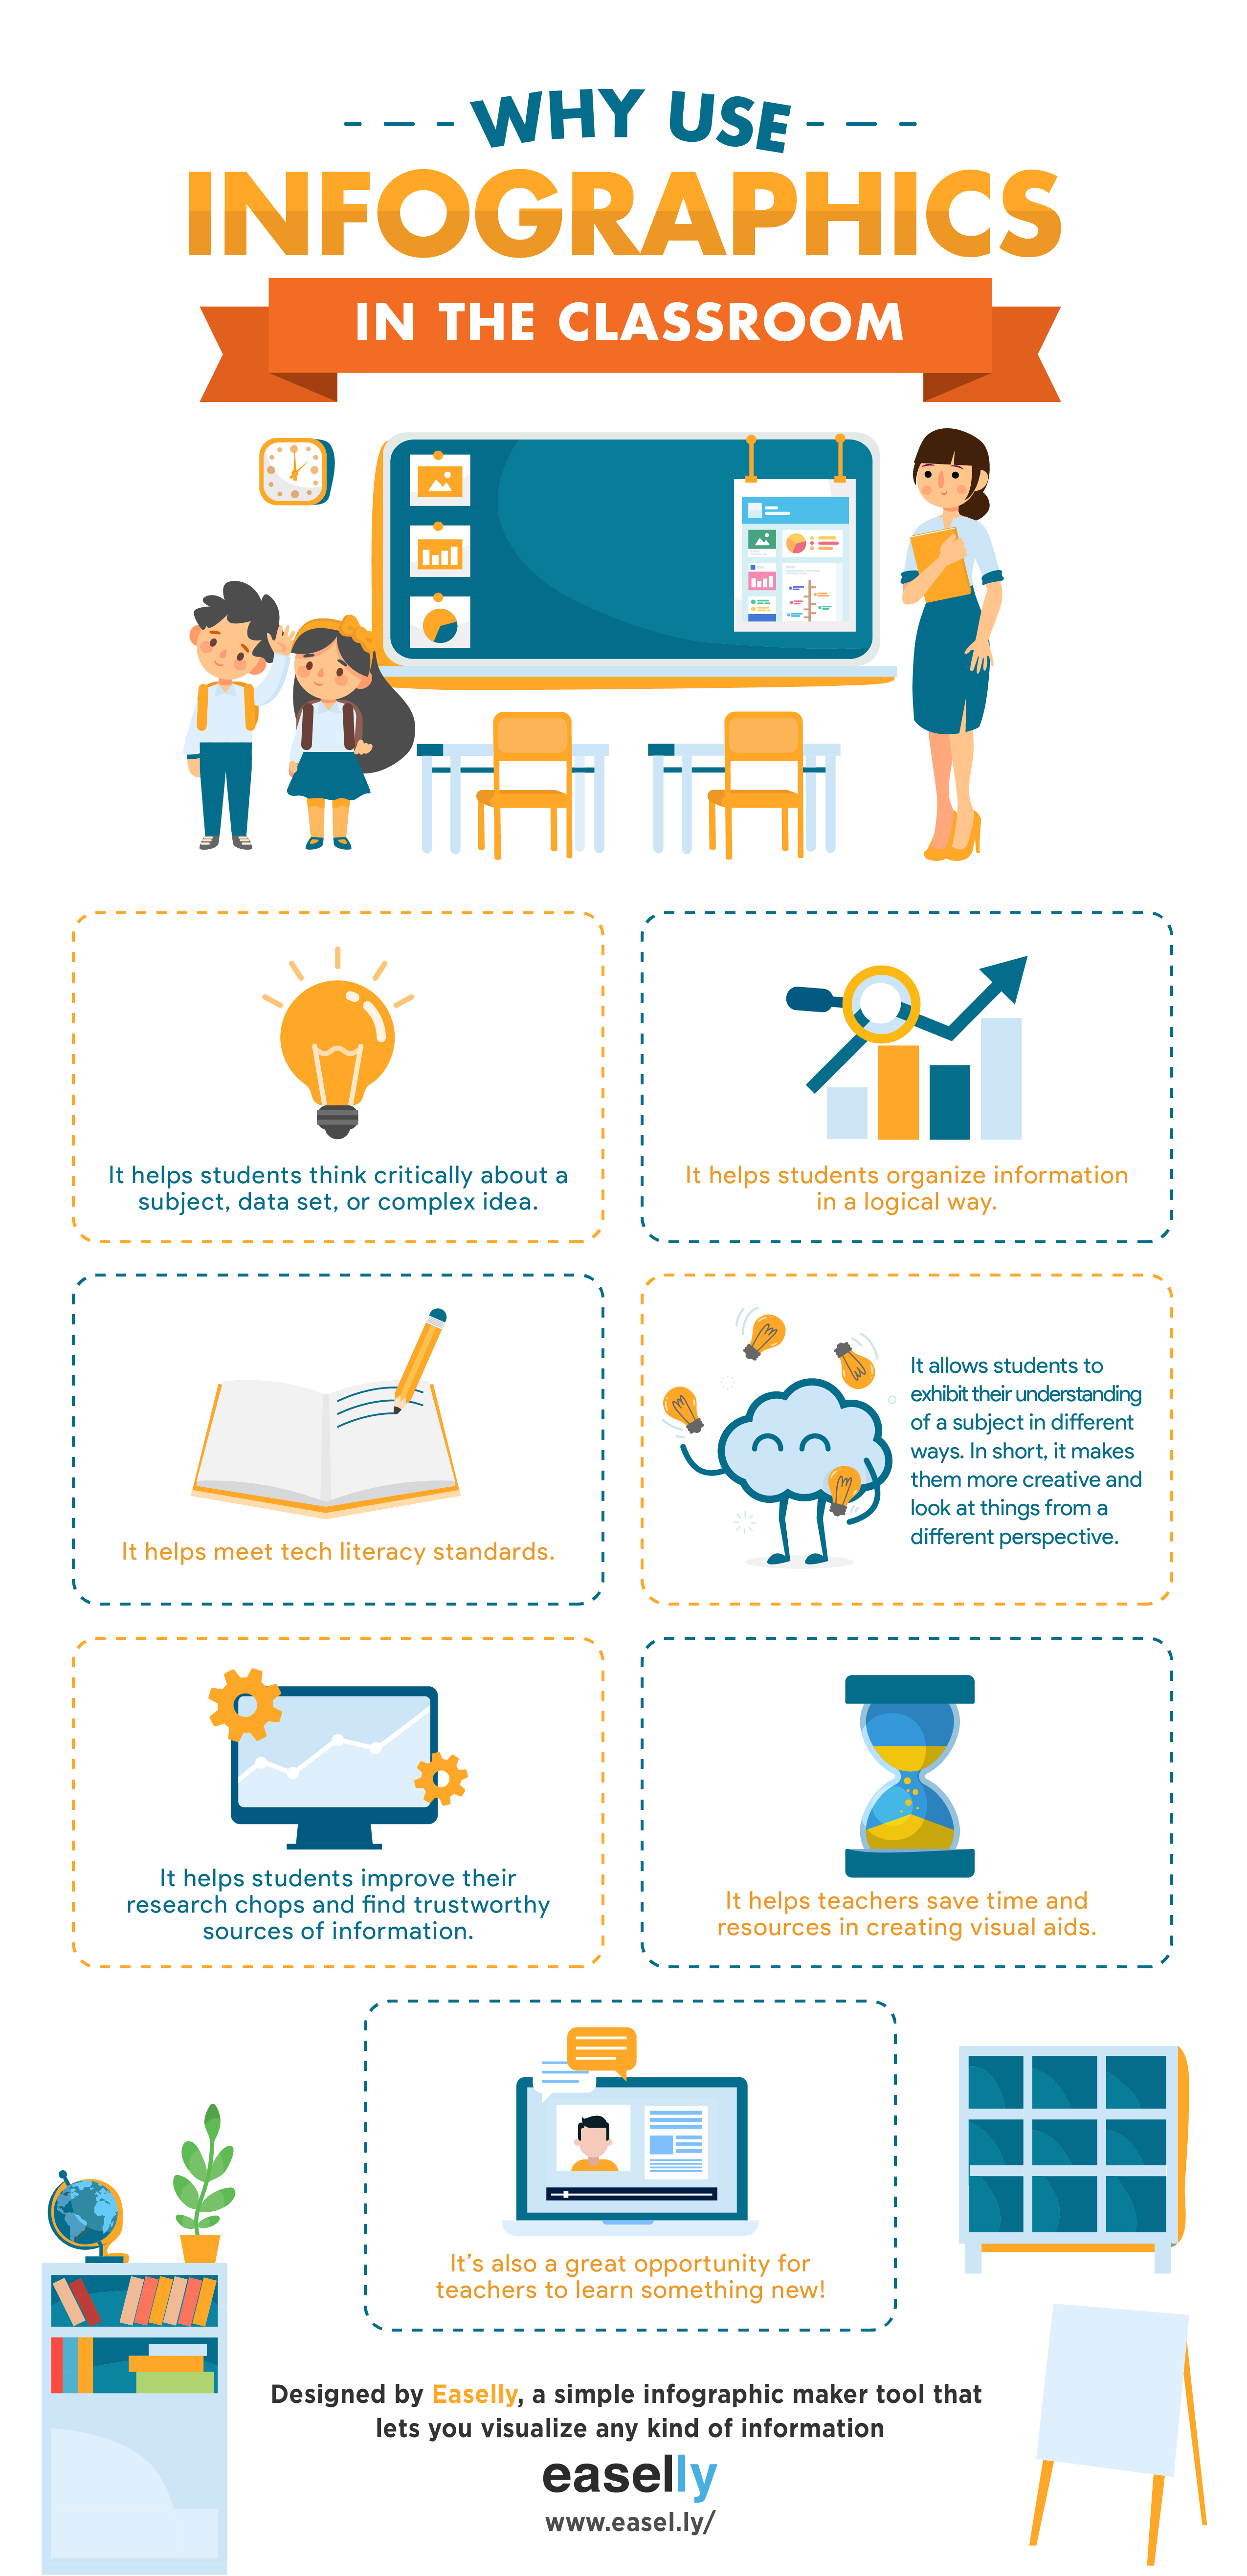
Utilizing infographics in educational storytelling leads to a plethora of advantages. It fosters engagement, encourages interactivity, and simplifies complex information. Moreover, well-crafted visuals can inspire discussions, prompting students to delve deeper into the topic and express their understanding creatively.
Frequently Asked Questions
1. How do I start creating an infographic?
Begin by outlining your main ideas and data. Choose a user-friendly design tool that aligns with your educational goals, and then structure your infographic to highlight key information effectively.
2. What tools can I use to create infographics?
There are several tools available for creating infographics, including Canva, Piktochart, and Adobe Spark. Each offers templates and features suited for various skill levels.
3. Can infographics aid in improving student engagement?
Absolutely! When information is presented visually, it captures students’ attention and encourages them to participate actively in their learning process.
4. How do I ensure my infographics are educational?
Focus on clear communication by incorporating accurate data and maintaining a logical flow. Additionally, use engaging visuals that support the narrative without overwhelming the viewer.
Targeting Infographics for Educational Storytelling
Creating infographics for educational storytelling primarily aims to enhance understanding and retention among students. I remember during a science project, we created an infographic summarizing the water cycle. The vibrant visuals and simplistic breakdown helped my peers grasp the concept faster than traditional methods. Using a platform like Canva, we illustrated each phase with images and concise text, reinforcing our learning.

This creative approach can be replicated in various subjects to bring lessons to life, making the learning process enjoyable and effective.
Closing Thoughts on Infographics for Educational Storytelling
Integrating infographics into educational storytelling opens up new avenues for engagement and understanding. By utilizing visuals in combination with compelling narratives, educators can foster a dynamic learning environment that resonates with students. As you embark on your infographic creation journey, remember that the ultimate goal is to simplify information while fostering curiosity and understanding in your audience.
If you are looking for The 7 Best Storytelling Infographics You Need to Check Out Now you’ve came to the right page. We have 10 Pictures about The 7 Best Storytelling Infographics You Need to Check Out Now like Elements of Storytelling, The 7 Best Storytelling Infographics You Need to Check Out Now and also The 8 Steps of A Great Digital Storytelling Process | Educational. Here it is:
The 7 Best Storytelling Infographics You Need To Check Out Now

www.pinterest.co.uk
infographic great storytelling story storyteller tell business infographics writing tips founders funders book process write notes outline visit steps ideas
Infographic Story Ideas

ar.inspiredpencil.com
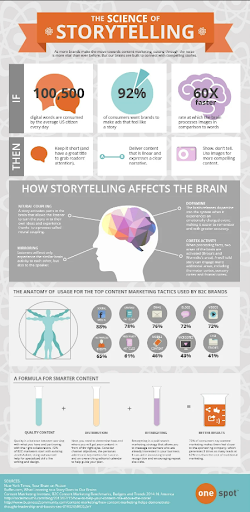
The Impact Of Brand Storytelling [Infographic]
![The Impact of Brand Storytelling [Infographic]](http://infographicjournal.com/wp-content/uploads/2014/07/StoryTelling.jpg)
infographicjournal.com
infographic storytelling brand impact business infographics bus infographicnow version size click full infographicjournal author
Story Telling With Infographics On Behance

www.behance.net
Storytelling Infographic I Made #Videography | Storytelling

www.pinterest.com
How Infographics Can Improve Your SEO

www.oncrawl.com
Infographic Story Ideas

ar.inspiredpencil.com
Business Storytelling Infographic For Content Marketing

contentmarketinginstitute.com
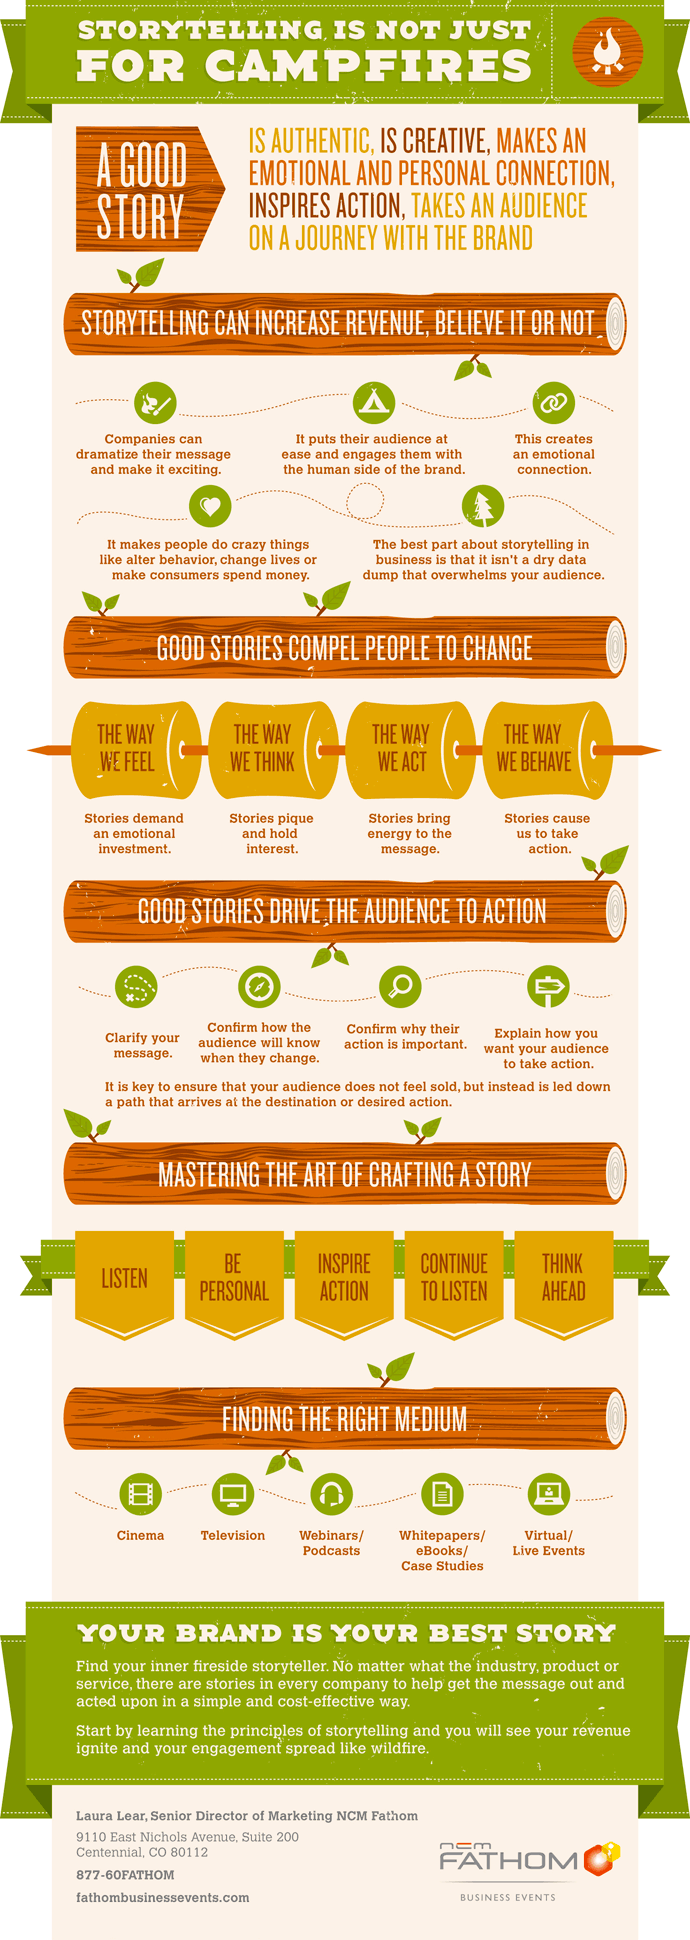
infographic storytelling marketing business story fathom tell just good campfires brand social great power use not businesses strategy example branding
Elements Of Storytelling

education.nationalgeographic.org
The 8 Steps Of A Great Digital Storytelling Process | Educational

www.educatorstechnology.com
digital steps storytelling process great stories learning ideas digitale tools creating teaching project grade chart technology help educational script create
Infographic story ideas. The 8 steps of a great digital storytelling process. Digital steps storytelling process great stories learning ideas digitale tools creating teaching project grade chart technology help educational script create


